
The Really Big Picture: When was the last time you thought about the long-term history of the market? We sometimes forget about that aspect of the market, getting caught up as we do with ordinary business of life. Between corporate earnings and the usual parade of economic releases (GDP, Productivity, Employment, etc.), it is quite easy to lose sight of the bigger picture amongst the day-to-day noise of the markets.
Indeed, the Stock Trader’s Almanac, like the Farmer’s Almanac before it, is based upon Twain’s observation that “History doesn’t repeat, but it sure does rhyme.” The historical record can often provide insight into present conditions. I thought it might be advantageous, therefore, to step back to consider “The Really Big Picture.”
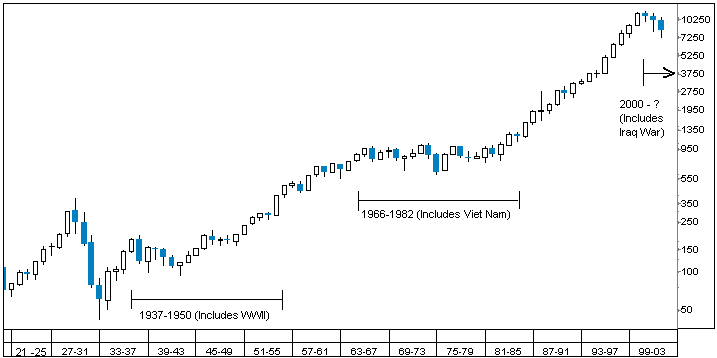
Begin by observing the chart below, covering the Dow Jones Industrial Average for most of the 20th Century (1921-2003). Unlike most charts, this one is “logarithmic” — it keeps proper proportions between every time the market doubles. The distance between 100 and 200 is the same as that between 1,000 and 2,000. Typical (geometric) charts tend to look toppy when viewed in the long term — even backing out the post 1999 period.
A panoramic viewpoint makes it obvious that Markets go through long phases — bullish, bearish and sideways — lasting anywhere from 5 to 18 years. Last century saw three secular Bull markets: The first lasted from 1921-29. The Dow went from 75 to 350+ — a 367% gain over 8 years. The post WWII Bull market 16 years later, and ran from 1945-63. It propelled the Dow from the low 200s to 1,000. That 354.5% gain occurred over 18 years. The next Bull market began some 19 years later in 1982. The Dow starting at 1,000, and by the time the Bull ended in 2000, the Industrials had peaked at 11,750 — a whopping gain of 1,075% in 18 years.
Human progress is inexorable. That explains why the overall bias of the market is up. It also rationalizes why Bear markets tend to be sharper — and much shorter — than Bulls: The Crash of ‘29 was followed by 4 consecutive down years (a feat not matched since). From a peak of 386 to trough of 41, the Dow declined 89 percent. By contrast, the recent Dow drop from 11,750 to under 7,200 was “only” a 38.7% fall (although Nasdaq got spanked worse, losing 78%). Compare that with the near 50% Dow declines of the early 1970s (1067 to 570 for 46.5%) or the late 1930s (195.6 to 97.5 for 50.1%).
Ned Davis Research has looked at many of the major Bear markets worldwide for the past Century, and found that they tend to last about a third as long as the preceding Bull. As a rough measure, that’s consistent with my findings regarding the Dow this past century.
Despite the Market’s overall upwards bias, many investors seem to overlook the extended periods of predominantly sideways action: The late 1930s saw an attempt to breach 200, which was unsuccessful until 13 years later (1950). In fact, the Dow did not get past its pre-1929 crash peak for 25 years (1954). A similar phenomena occurred after the post-war Bull market. The Dow kissed the 1000 level in 1966, but was unable to permanently penetrate that plateau for 16 years (1982).
There is a noteworthy aspect of each of these two range-bound periods of sideways trading action: Each followed extended Bull markets; each also occurred while the United States was involved in a major military conflict (WWII and Viet Nam).
The “Buy & Hold” mantra is tough to argue with during an 18 year Bull market. During the 1982-2000 period, indexing and Buy & Hold were the strategies that succeeded best. Despite the brutality of the recent Bear market, some adherents still cling to this philosophy, despite their recent pain. Indeed, a recent Bloomberg column suggested that the 6 month, 45% rally in the Nasdaq validated the “Buy & Hold” philosophy.
I disagree. As the chart makes clear, there are periods when that strategy will deliver sub par returns. The rally off the March lows, and the nearly 100% gains since October 2002 still leaves the Nasdaq more than 60% below its peak. Its a textbook case of “been down so long it looks like up to me.” Despite nearly doubling, the “Buy & Hold” investor who made purchases in early 2000 have still lost more than half their capital. Those are not the numbers that support a blind methodology.
John Maynard Keynes : John Maynard Keynes famously quipped: “In the long run, we are all dead.” To most investors, the long run is not what truly matters. Rather, it is the next 20 years. This is especially true for the 40-50 year old Baby Boomers, who will be retiring in 2015-2020. What the market does between now and then is of penultimate importance to this group.
The panoramic view leads me to the present conclusion. Following an 18-year Bull market, and a three year Bear market, we are now committed to what looks like a long-term military obligation in Iraq. In the grand scheme of things, I suspect we are in for a harder long-term slog than the mere 3 year Bear market suggests.
Historically, this suggests an extended period of range bound trading as the highest probability long-term scenario in my view. I expect vicious rallies, and wicked sell-offs to occur — over shorter term cycles — within the larger timeline. Active management and capital preservation are going to be the key methods of outperformance.
Chart of the Century:
Long-term perspective of the Dow Jones Industrials:
DJIA 1921-2003 (logarithmic chart)
(doubleclick for full pop image)

Source: Bloomberg Analytics
Unlike most charts you see, this one is logarithmic meaning that it keeps the proportions the same each time the market doubles. The distance between 100 and 200 is the same as that between 1,000 and 2,000. As opposed to say this one, shown in Dow 10,000 and “Buy & Hold” (above).

The charts could also be “normalized” for inflation. Thus a 1000 DJI in 1968 is not the same as a 1000 in 1982 because of roaring inflation in the 1970’s.
Step right this way…
And into the big tent for the fifth edition of the Carnival of the Capitalists. We’ve got a fantastic assortment of posts for you this week, as always, so I’ll shut up and get out of the way. Please note…
Hey, the Dow only goes up??
Hey, the Dow only goes up??