
U.S. home prices show continued record declines and double digit declines in existing single family homes across the United States.
During the 1990-92 cycle the record low was -6.3%. While the annual returns of the two indices continue to reach record lows, the pace of the decline has slowed, particularly over the last three months. For the three months of May thru July, home prices cumulatively fell about 2.2%; whereas for the three months of February thru April, and November 2007 thru January, the cumulative rates of decline were closer to 6.0-6.5%.
“There are signs of a slow down in the rate of decline across the metro areas, but no evidence of a bottom” says David M. Blitzer, Chairman of the Index Committee at Standard & Poor’s. “Little positive news can be found when cities like Las Vegas and Phoenix report annual declines as large as -29.9% and -29.3%, respectively, and all 20 cities are still in negative territory on a year-over-year basis. The Sunbelt continues to be the story, with the seven cities that basically represent that area reporting annual declines roughly between 20 and 30%.
While some cities did show some marginal improvement over last month’s data, there is still very little evidence of any particular region experiencing an absolute turnaround.” (emphasis added)
Here is the Case Shiller Price Indices, and a table of cities:
>
S&P/Case-Shiller Index – July 2008
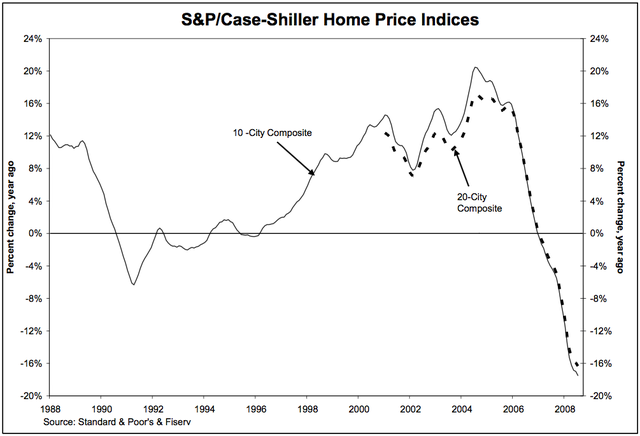
chart courtesy of Standard & Poors
>
S&P/Case-Shiller Index – July 2008
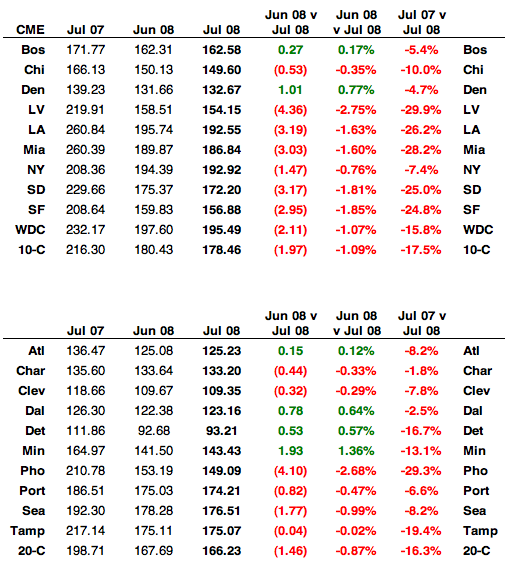
table courtesy of TFS Derivatives
>>
Source:
Continued Record Home Price Declines
S&P/Case-Shiller Home Price Indices, July 2008 (published Sep. 30)
http://www.homeprice.standardandpoors.com
(Spreadsheet)

What's been said:
Discussions found on the web: