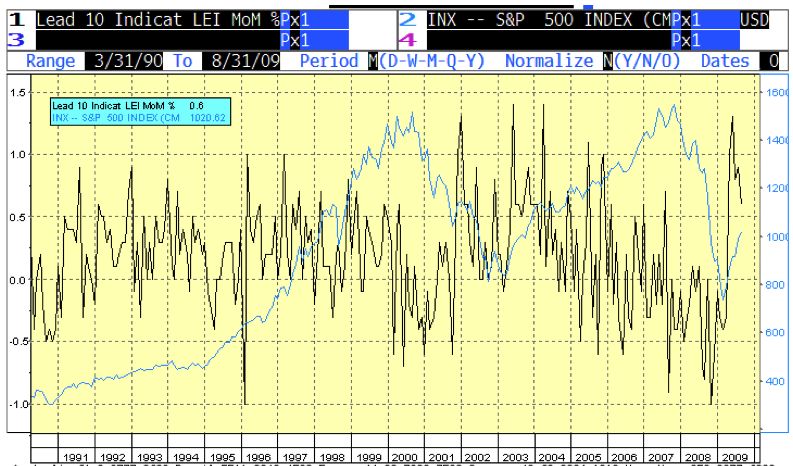
Bill King points out that the “LEI, which has increased for five straight months, is heavily weighted to monetary indicators and the stock market. Its predictive value for the stock market has been poor due to over-used monetary stimulus.”
>
chart courtesy of Bill King, Ramsey Securities
>
The LEI trended lower from 1997 to 2000 as US stocks bubbled. It declined from 2004 to 2008 as the monetary medication carried a diminishing effect on the real economy.
Economist Dr. Michael Hudson notes a related pet peeve: We’re in a phase change where the economic relationships, proportions, leads and lags do not operate as they did in the past. So any mathematical model that’s based on this sequence is going to be junk mathematics. The last time we had junk mathematics we had the big financial crises that we’re bailing out today.


What's been said:
Discussions found on the web: