Detailing T-Bill Purchases
In the post below, we detailed Treasury purchases from the Federal Reserve’s Q3 2009 Flow of Funds report. Our conclusion is that the buyer comes from the “plug category” of households which bought $167.96 billion. We are not sure who the real buyer is, but it is not foreigners, banks, mutual funds or brokers as these groups are accounted for by their own categories.
While we cannot pinpoint the real buyer, we do know that “they” are buying T-bills in record amounts.
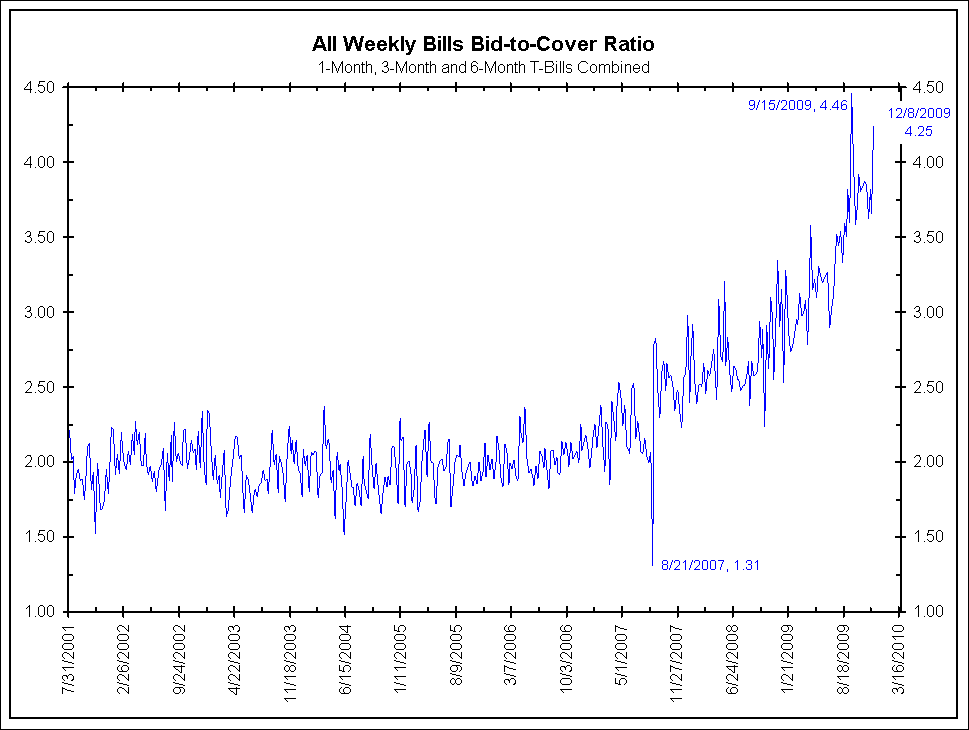
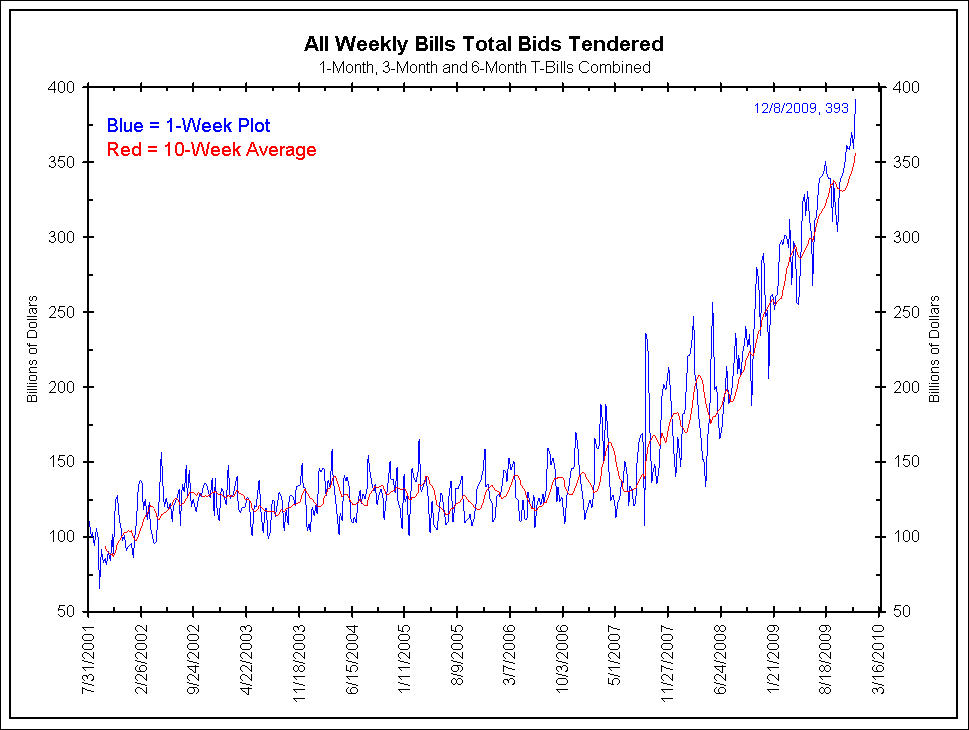
The first chart shows the bid-to-cover ratio for the 1-month, 3-month and 6-month auctions combined. It is soaring to well over 4. The second chart shows the raw dollar amount in bids every week for these same three auctions. Currently some $400 billion a week is desperate for T-bills. This is almost double the amount of bids for bills seen a year ago when the flight to quality trade was in full bloom amidst the financial collapse.
<Click on chart for larger image>
<Click on chart for larger image>
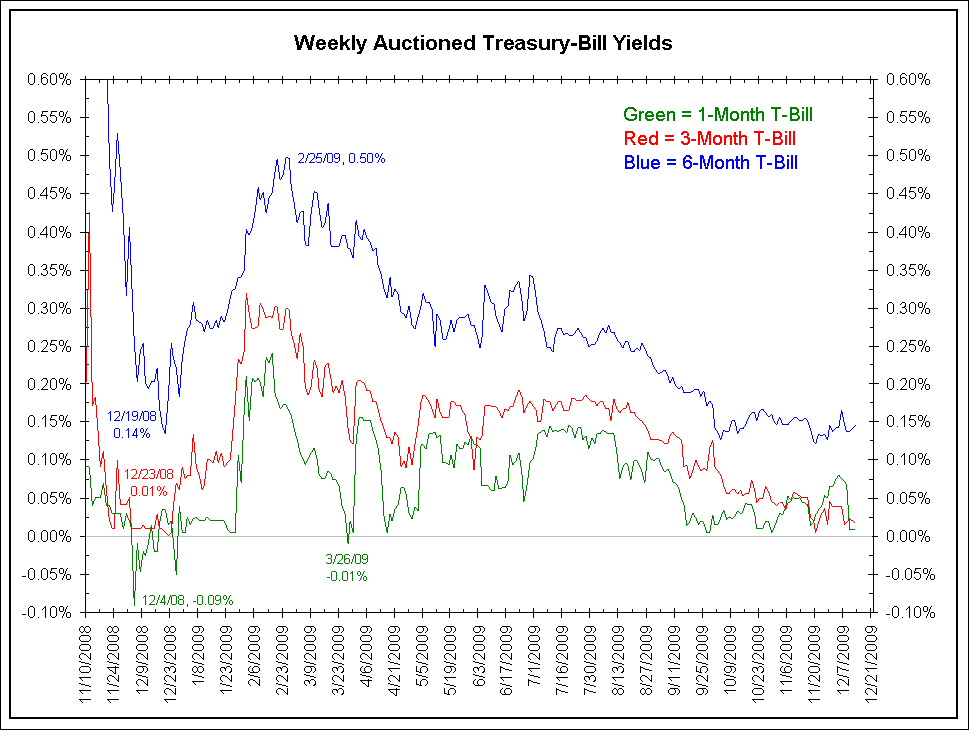
As the next chart shows these bids are getting near 0% interest rates. So, there is no carry trade possibility with these securities.
<Click on chart for larger image>
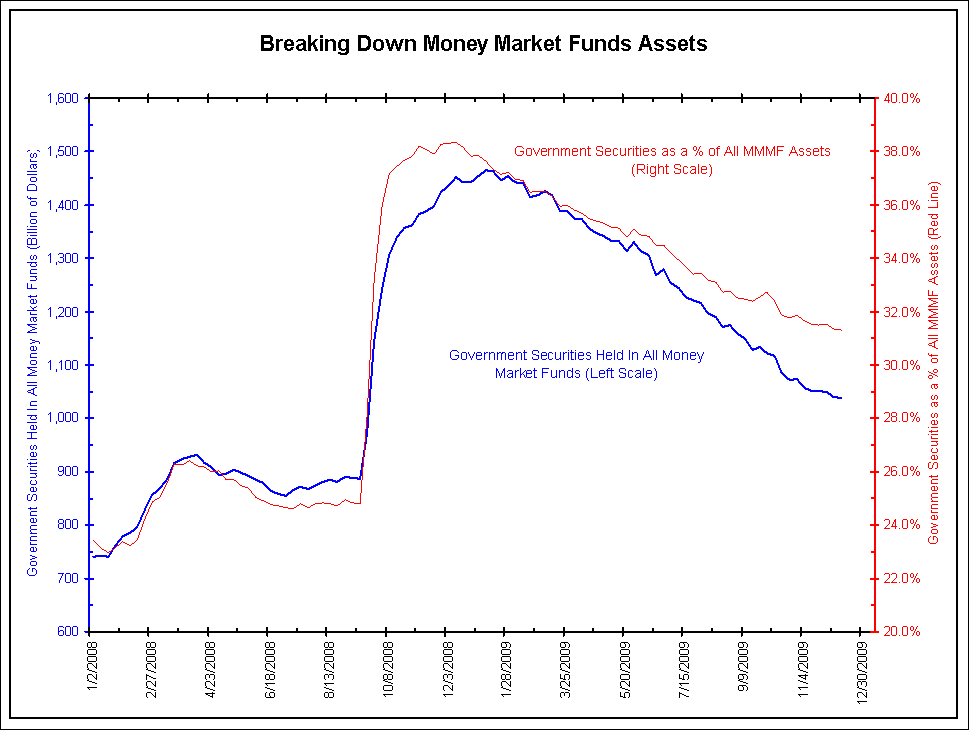
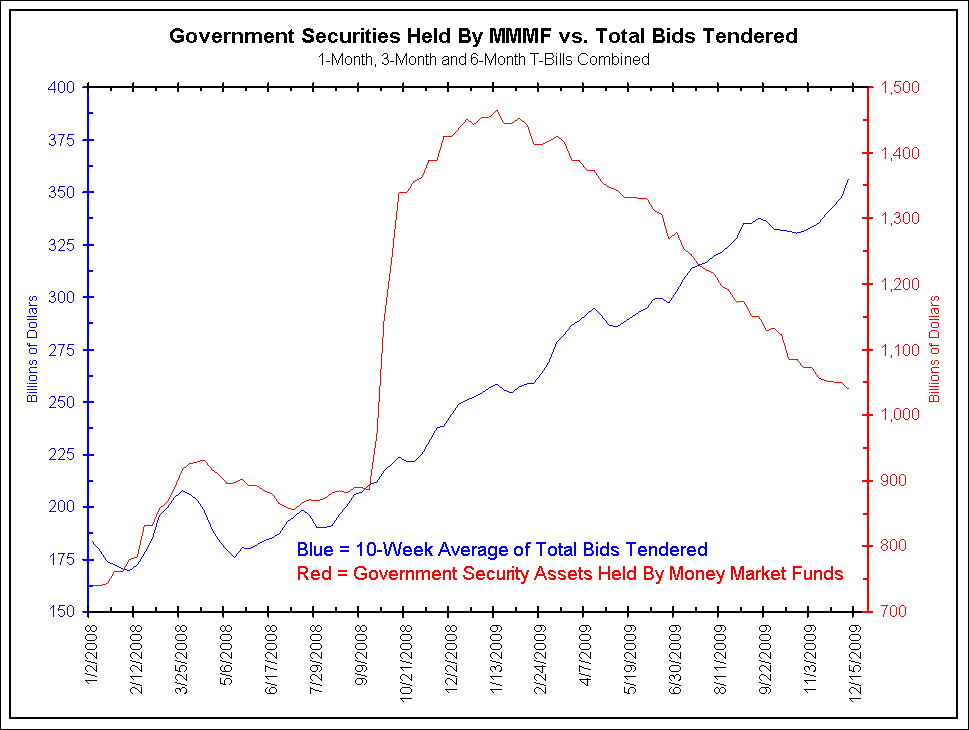
We often hear the argument that money market funds are driving these flows. As the next chart shows, this group is actually reducing its holdings of Treasuries. As the chart under that shows, T-bill bids have increased even as money market holdings of T-bills fall.
<Click on chart for larger image>
<Click on chart for larger image>
Conclusion
Even after looking at the above charts, we still cannot pinpoint the real buyer of Treasuries. However, we are sure they are buying bills that yield nothing and bidding more and more every week for the privilege to earn nothing.


What's been said:
Discussions found on the web: