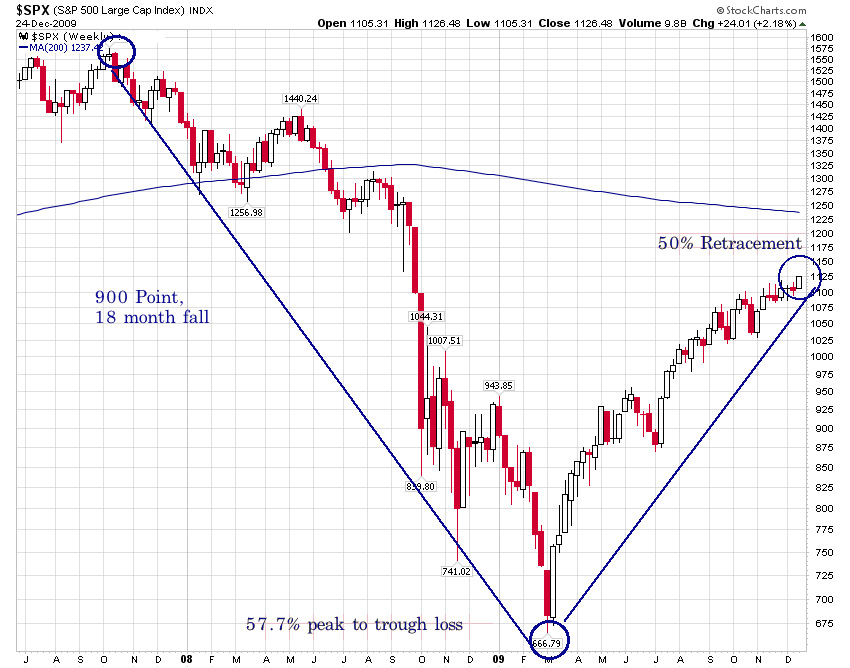
The S&P 500 closed at 1126 this week — 5 points over the 1121 level.
Why is that significant? Because 1121 marks the midpoint between the index’s 2007 peak of 1565 and its 2009 low of 676. If you prefer to use intra-day peak and trough numbers — 1576 and 666 — you still get 1121 as a midpoint. (Bloomberg has the 50% mark pegged as 1,120.84).
As the Barron’s Trader column points out:
“Enough traders watch this to turn it into a self-fulfilling prophecy: Failure at this key juncture foments doubt, but surmounting it will mean the stock market has recovered half of its bear-market losses, which might validate the recovery and beget more buying.”
A classic “If it goes up, we are going higher, if it goes down, we are going lower” type of analysis.
Here’s a purty chart that shows the numbers more clearly:
>
Note that the 200 week moving average is a reasonable upside target from here. Worth noting for you chart watchers . . .


What's been said:
Discussions found on the web: