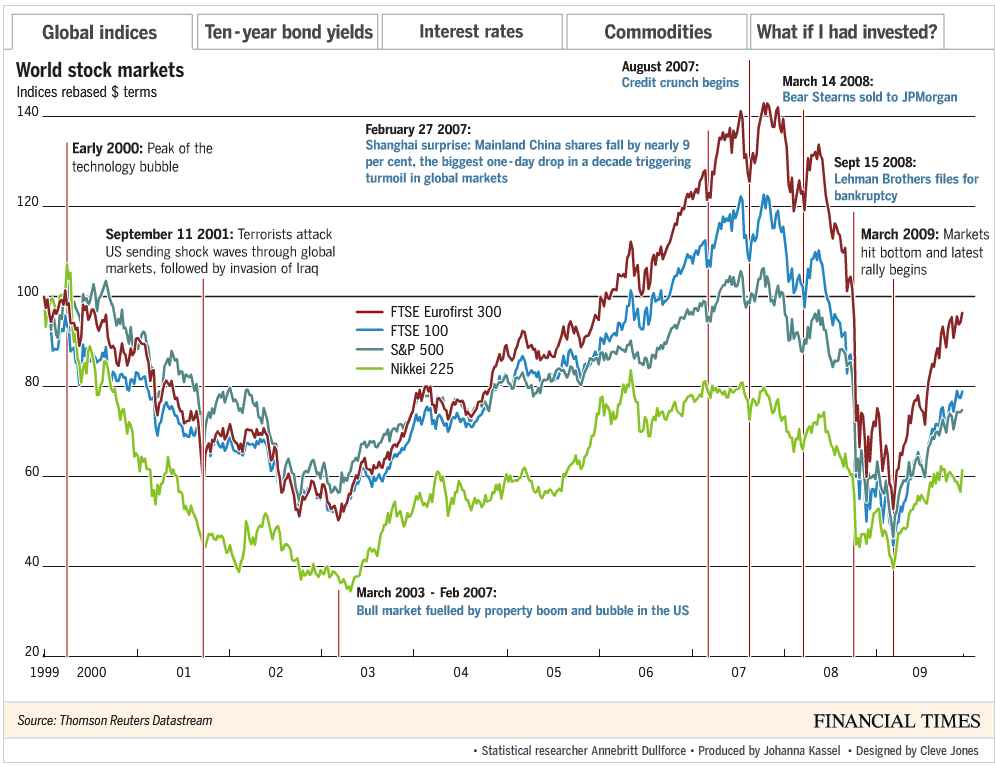
Nice interactive graphic of the last decade from the FT showing various world markets — stocks, bonds, commodities — in the context of the major global events:
>
click through for interactive chart

Chart courtesy of FT
>
Hat tip Simon!
>
Source:
The decade in markets
Johanna Kassel and Cleve Jones
FT, December 21 2009 17:07 | Last updated: December 21 2009 17:07
http://www.ft.com/cms/s/0/fee44b50-ee52-11de-944c-00144feab49a.html


What's been said:
Discussions found on the web: