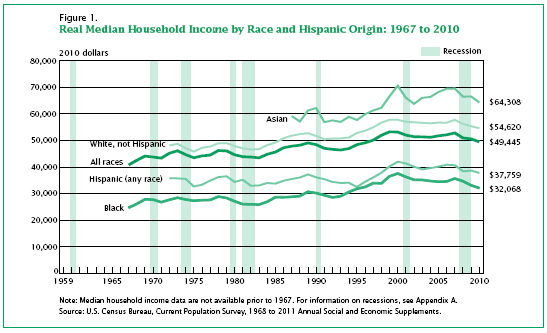
The Census Bureau released its annual report on Income, Poverty, and Health Insurance Coverage: 2010 (full PDF) this morning. Barry has posted the slide presentation that staff went through during the conference call over in the Think Tank (please have a look). The (very ugly) bullet points from the release can be found here, and the centerpiece graph is below.
As time allows, I intend to do some work on the numbers in the updated report, but here are a few things that jumped out at me (straight from the summary):
- Real median household income in the United States in 2010 was $49,445, a 2.3 percent decline from the 2009 median.
- Since 2007, the year before the most recent recession, real median household income has declined 6.4 percent and is 7.1 percent below the median household income peak that occurred prior to the 2001 recession in 1999.
- In spring 2011, 5.9 million young adults age 25-34 (14.2 percent) resided in their parents’ household, compared with 4.7 million (11.8 percent) before the recession, an increase of 2.4 percentage points.
- It is difficult to precisely assess the impact of doubling up on overall poverty rates. Young adults age 25-34, living with their parents, had an official poverty rate of 8.4 percent, but if their poverty status were determined using their own income, 45.3 percent had an income below the poverty threshold for a single person under age 65.
- Based on the Gini Index, the change in income inequality between 2009 and 2010 was not statistically significant, while the changes in shares of aggregate household income by quintiles showed a slight shift to more inequality. The Gini index was 0.469 in 2010. (The Gini index is a measure of household income inequality; zero represents perfect income equality and 1 perfect inequality.)
More to come.


What's been said:
Discussions found on the web: