Yesterday, I went into some detail as to why a few people got the NFP data so (disingenuously) wrong. Then Invictus pointed me to this Economic Populist post, titled, Getting It Wrong on the BLS Employment Report. It came out late on Friday, hence why it may have been overlooked.
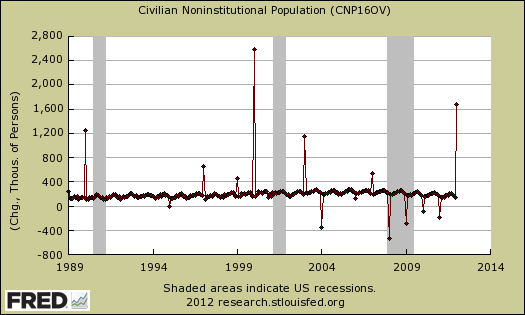
The long term chart via FRED shows the impact the Census has every 10 years on the civilian population. As you can see in the first chart below, this baseline adjustment to population is about 25% larger than 1989’s, but 35% smaller than 1999’s:
>
Decennial Change Reflecting BLS incorporating Census Readings

>
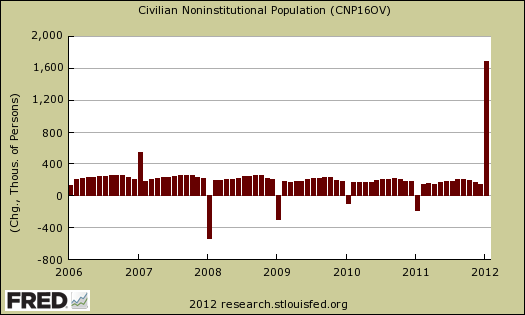
The next chart shows the BLS annual population benchmark to make sure their models reflect the latest estimates of population size, growth and characteristics. Note the monthly change between December and January every year — that is the yearly population adjustments.
These are not month-over-month changes, they reflect the adjustments made for the prior year showing up all at once in the month of January.
Hence, to quote the Economic Populist, “it is statistically invalid to compare December to January monthly changes. You simply cannot compare a change of a month, when one of those month’s includes a year of population adjustments.”
Annual Change in BLS Population Measures

>
Anyone who thinks that 1.2 million people suddenly dropped out of the labor force needs to take a basic statistics course. I wont hold my breath waiting for the usual suspects to admit their errors.
>
Source:
Getting It Wrong on the BLS Employment Report
Robert Oak
Economic Populist Fri, 02/03/2012 – 21:46,
http://www.economicpopulist.org/content/getting-it-wrong-bls-employment-report


What's been said:
Discussions found on the web: