
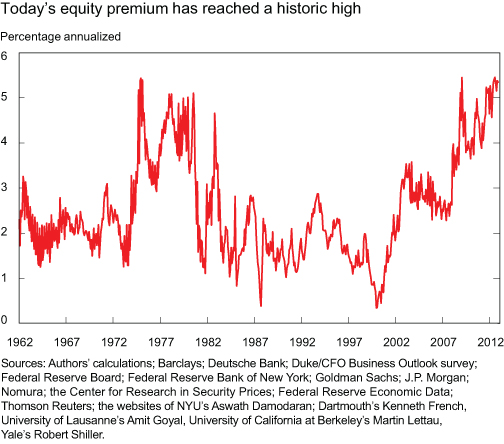
Last week, I posted the above chart from the NY Fed’s Liberty Street Economics. This morning on Squawk Box, David Tepper of Appaloosa discussed it — and his comments reversed the futures from negative to positive.
Here is a brief explanation of what this chart — a compilation of 29 valuation models — means:
The equity risk premium is the expected future return of stocks minus the risk-free rate over some investment horizon. Because we don’t directly observe market expectations of future returns, we need a way to figure them out indirectly.
That’s where the models come in. In this post, we analyze twenty-nine of the most popular and widely used models to compute the equity risk premium over the last fifty years. They include surveys, dividend-discount models, cross-sectional regressions, and time-series regressions, which together use more than thirty different variables as predictors, ranging from price-dividend ratios to inflation. Our calculations rely on real-time information to avoid any look-ahead bias. So, to compute the equity risk premium in, say, January 1970, we only use data that was available in December 1969.
If you look at the chart, we are at levels that are similar to 1975 and 1982.
An emailer last week asked me why I “waste space” occasionally publishing Fed research, academic papers and other such works. Now you know why . . .
Previously:
Are Stocks Cheap? A Review of the Evidence (May 9th, 2013)
Appaloosa’s Tepper Bullish on Stocks (Still) (May 14th, 2013)

What's been said:
Discussions found on the web: