
Click to enlarge
We have not looked at this chart in a few quarters.
Here’s Merrill:
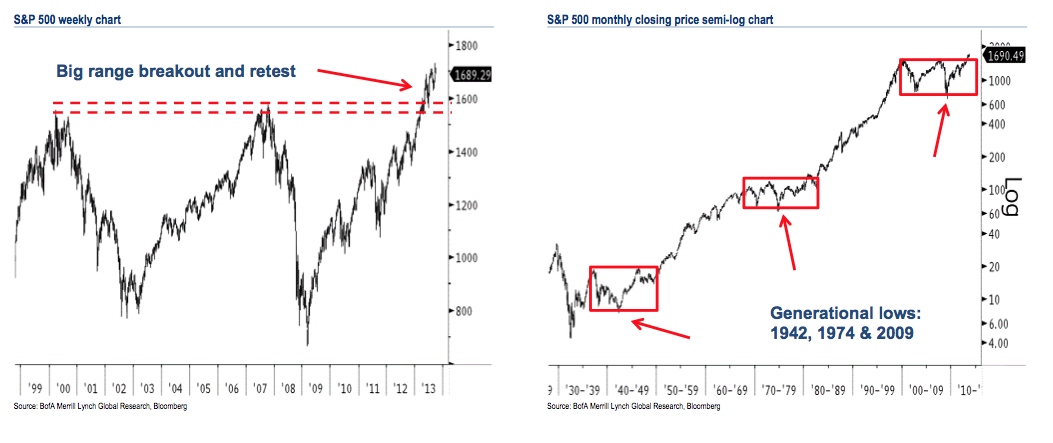
Secular bull market roadmap: The S&P 500 broke out to new all-time highs in April and has held this breakout. The retest of the prior highs in June confirmed the breakout (prior resistance acted as support) and this is a secular bull market pattern. Holding 1575-1530 keeps this breakout intact.
History of big range breakouts: Upside breakouts from big trading ranges are bullish long-term even if the US equity market pulls back and spends time retesting the upper portion of the secular trading range.
The key question is, are we now 5 years into a 1982 – 2000 type of a secular bull market, or is this merely a post 19734-74 bounce?
Source:
Stephen Suttmeier, MacNeil Curry, Jue Xiong
Monthly chart portfolio of global markets
Bank of America Merrill Lynch, October 1, 2013

What's been said:
Discussions found on the web: