
From Bank of America Merrill Lynch:
The Sell Side Indicator — our measure of Wall Street’s bullishness on stocks — moved sideways in December, unchanged from November’s reading of 52.1. At the start of the year, it was 53.3. The indicator remains in “Buy” territory, as Wall Street’s bearishness is still more extreme than at the market lows of March 2009. Given the contrarian nature of this indicator, we remain encouraged by Wall Street’s ongoing lack of optimism and the fact that strategists are still recommending that investors significantly underweight equities, at 52.1% vs. a traditional long-term average benchmark weighting of 60-65%.
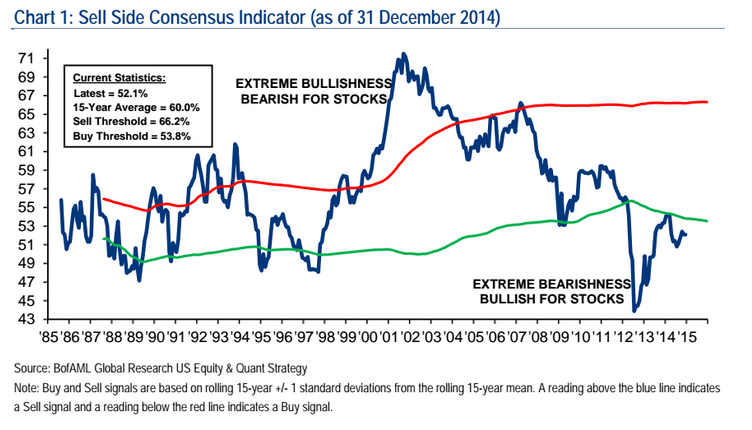
Source: BofA Merrill Lynch

Looks to me like the chart legend has errors- I believe it should read, “A reading above the RED line indicates a Sell signal and a reading below the GREEN line indicates a Buy signal.”
If my suggestions are incorrect, then I really don’t understand the chart.
your basically right. money pulling out of energy looking for a new home is a example of a bullish market. one sector rotating over to another.
Release the hounds! Can we do -400 to ring in the New Year?