
“When an inflation overlay is included, P/Es don’t look as expensive”
-Sam Stovall
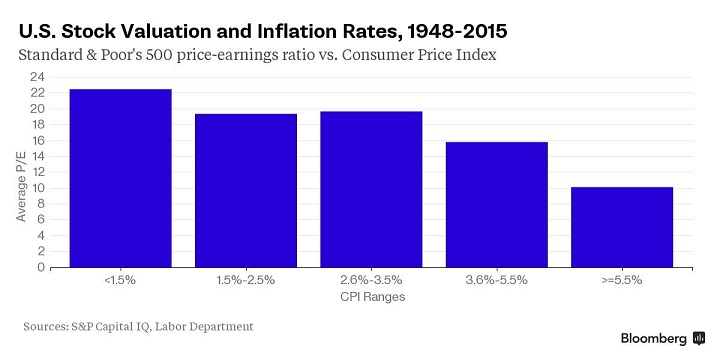
The U.S. equity strategist at S&P Capital IQ suggests that one must include low yields and low inflation rates when determining if stocks are expensive. The chart above shows average price-earnings ratios for the Standard & Poor’s 500 Index since 1948 at five ranges for the consumer price index. (GAAP Earnings based on quarterly data).
Year over year inflation rates of less than 1.5 percent has an S&P 500 average P/E of 22.5; its currently trading at a P/E of 21.3.
Earnings based on methods other than GAAP also make stocks look cheaper, according to the report.
Stovall also cited data showing the S&P 500 ratio was 18 percent higher than the average regardless of CPI. The S&P 500 ended last week at 17.8 times operating earnings, which exclude unusual items. The ratio is 16 percent lower than the GAAP reading.

So then valuations have nowhere to go but down based on CPI.
If you dip into negative CPI then companies have earnings pressure from increasing debt burden.
The only hope is a combo of rising earnings and CPI staying near all time measured lows.
Unless earnings go up when inflation ( and economic activity) pick up.
The chart also wastes a lot of ink. The present PE ratio is below the AVERAGE PE ratio for the lowest inflation case. But what are the ranges of PE for each case? What is one std dev above or below the average?
The 6-foot tall man drowned in a river that was 5 feet deep on average.
The highest PEs and lowest inflation readings of the past 100 years have often occurred during recessions or the first year out of them, so justifying a high current PE based on low inflation 6 years into the upslope of a business cycle doesn’t make a lot of sense. It’s apples vs oranges.
I am so pleased that investors suddenly became very sophisticated in 1948 so that the P/E, interest rate, and inflation-deflation relationships of the first half of the century would never return.
We basically saw an increasing inflation and interest rate environment from 1948 to 1980 and then it reversed from 1980 until today. That is only one big up-down cycle with 20-30 year long up and down periods, hardly something to hang a universal framework on.
so does this mean I should buy or sell ??
yes.