
How Healthy Is Housing?
High-end real estate is doing great; the rest so-so.
Bloomberg, June 18, 2015
For reasons I have yet to fully appreciate, there is a lot of confusion about the state of residential real estate in the U.S. Simply by looking at some of the data we can clear up a lot of the muddle.
The short explanation is that housing, along with the rest of the economy, has been recovering, albeit slowly. The longer explanation is regional, complex and bifurcated (just like the rest of the economy).
There are five elements to consider when assessing the state of housing in the U.S.:
— Homeownership rates
— Mortgage rates
— Low equity/low inventory
— Uneven recovery
— Luxury versus ordinary home sales
I left out the falling jobless rate and weak wage growth because these affect, well, everything else in the economy. A huge part of the residential real estate story tracks the path of the recovery in labor markets and wage gains, both of which have been rebounding for the past five years.
Let’s take a closer look at these five elements:
Homeownership rates: According to the Census Bureau, the U.S.homeownership rate has fallen to 63.7 percent, the lowest since 1989. Normally this rate is pretty stable and holds in the mid-60s (though it soared to more than 69 percent during the housing bubble). As older homeowners retire, they are replaced by new families.
In recent years, a lot of baby boomers have been retiring, leaving the ranks of homeowners. But we also have had relatively weak household formation — millennials living in their parents’ basements and all that. Combining these two demographic trends gives you a recipe for low homeownership rates.
We are beginning to see signs that household formation is turning around. If that holds up, expect homeownership rates to stop falling, and perhaps even reverse.
Mortgage rates: Interest rates have been a great help to homebuyers. Since early 2011, they have been lower than 5 percent and for much of that time they have been at or near record lows. If we take the Federal Reserve at its word and we begin to see a gradual increase in short-term rates, those lows are behind us.
I understand that mortgage rates will still be low by historical standards even if they rise by one or two percentage points. But anything that raises the monthly carrying costs of a home purchased with a debt acts as a drag on the market.
Low equity/low inventory: The two are related. As my Bloomberg View colleague Jonathan Miller has noted, “Sellers, when they sell, become buyers (or renters) and with more than 40 percent of mortgage holders having low or negative equity, they don’t qualify for the trade up. We have been so focused on negative equity that we’ve paid short shrift to the impact of low equity.”
So we have modest demand for home purchases and even more modest supply of homes for sale. That is why prices have been rising as much as they have (though they have been moderating of late).
Uneven recovery: Like so much else in the post-credit-crisis recovery, housing gains have also been very uneven. Travel around the country, and this becomes obvious. In places where the local economy is doing well, the housing market is also doing well.
Have a look at Trulia’s Bubble Watch map. Areas with stronger economic growth — coastal cities, especially — have higher valuations. Regions with more modest growth, especially the Midwestern rust belt and much of the rural and exurban Northeast, are still relatively inexpensive. This shouldn’t come as much of a surprise to anyone.
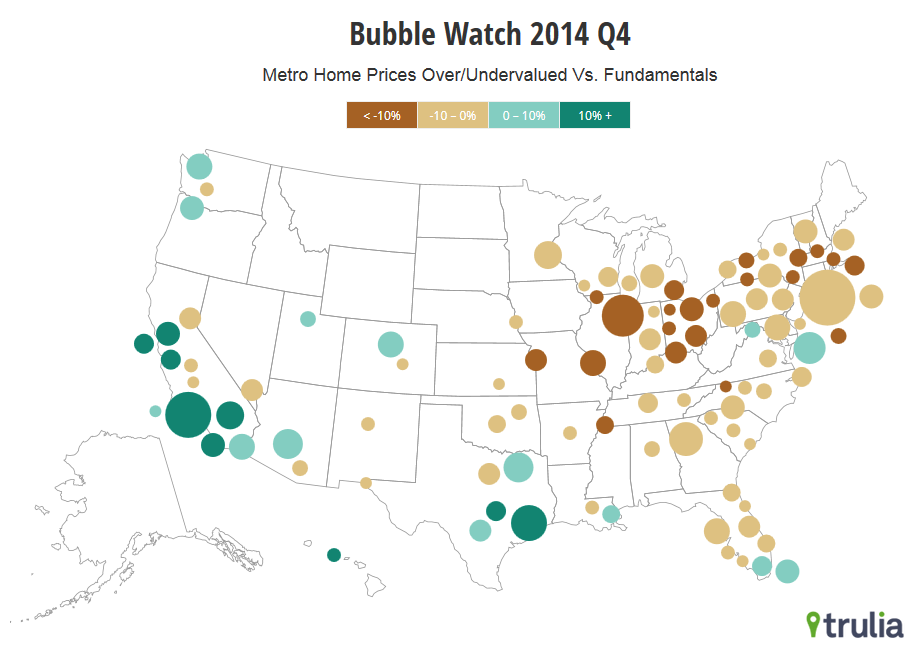
Source: Trulia
Luxury versus ordinary home sales: How disparate are housing valuations and sales? Consider this data point from the Demand Institute’s 2000 Cities Report: As of 2012, the top 10 percent of U.S. housing stock “held 52 percent of aggregate housing value, worth nearly $4.4 trillion . . . Contrast this with the bottom 40 percent, which accounted for just 8 percent of the housing value of all 2,200 communities.”
This is consistent with what we see in luxury markets such as New York, San Francisco and several other major cities. It led my colleague, Jonathan Miller, to wonder “how long before a home lists for $1 billion?” The conclusion: just a matter of time.
Thus, we can see that the state of the U.S. housing recovery is similar to that of the economy overall: It is slowly improving, but faces headwinds. It remains highly regional and unevenly distributed, with the top end doing better than the rest.
Originally: How Healthy Is Housing?

The term: “homeownership rate” misleads most people. By official definition, it is the percentage of homes that are occupied by the owner. It’s not the percentage of adults that own their own home.
A counter-factual argument can be made that as the middle class regresses to its long term historical averages in terms of income share, so the percentage of homeownership will regress to it’s 110 year historical average: 55.76%
That number, by the way, would put us closer in line with Central Europe – Germany, Austria, Switzerland – all have ownership levels in the low to mid 50’s percentage range. Economically, they seem to be managing quite well despite all that.
Home ownership “damage” – if you want to look it that way – is mostly an event that happened to the 35 to 54 age group. The home-owning percentage for the baby busters has shrunk from 70 to 59% over the past decade. These folk, very historically, was the peak cohort for home buying; either getting into their first homes, or more so, scaling up to a bigger/better home.
For the most part, the 55-70 cohort, i.e. primarily the Boomers, have actually fared quite well. Especially, if we are white privileged…