
@TBPInvictus
A couple of recent items got me thinking.
First was this Tweet from Dave Weigel, detailing what New Jersey Governor Chris Christie thinks of Friday’s announcement that the national unemployment rate had dropped to 5.1 percent (lower, I might add, than at any time under St. Ronnie’s presidency).
Christie says the official low unemployment # is bunk: “There’s someone in the Perkins building who just throws darts at a dartboard.”
— daveweigel (@daveweigel) September 4, 2015
There was also this one from Josh Barro, who recently interviewed Peter Schiff about the economy, the dollar, interest rates and, of course, gold. Schiff believes that the government essentially fudges the inflation numbers and that the economy’s been in recession for the entirety of the Obama administration (nothing about what was going on under Bush). I urge you to watch the video.
I forgot to share this but Peter Schiff & I had a fun conversation last month about whether CPI stats are cooked: https://t.co/BT8iqdSHO4
— Josh Barro (@jbarro) September 6, 2015
Of course, anyone who’s been paying attention for a while can’t help but recall the Godfather of all Tweets, from whence it all began – Jack Welch’s infamous October 2012 Tweet. Welch was basically claiming that Team Obama cooked the jobs numbers, and did so in such a way, of course, that his re-election was assured. (See Barry’s post on Welch’s book-cooking GE days here.)
Unbelievable jobs numbers..these Chicago guys will do anything..can’t debate so change numbers
— Jack Welch (@jack_welch) October 5, 2012
So, the unemployment rate is cooked. So are the inflation numbers. Basically, any numbers that reflect favorably on Team Obama, or the economy on his watch, are bogus.
Which brings me to very oft-cited Labor Force Participation Rate (LFPR). Secretary Perez, dude. Seriously. WTF are you not doing with the LFPR? How are you letting it languish at multi-decade lows and giving talking points to the right wing?
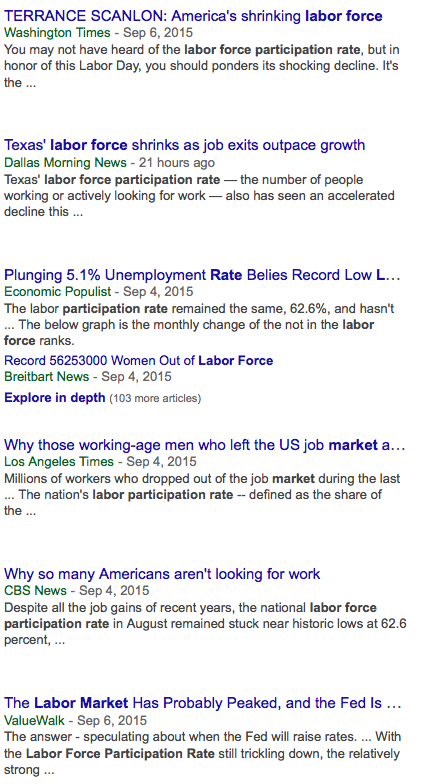
Herewith just a smattering of news stories on the LFPR after last Friday’s jobs report:
There’s an easy fix to be had for our flagging LFPR, and it’s hard to believe I’m the first to think of it: The number must be cooked, like all the other government statistics the right complains about. I mean, what’s the point of fudging the unemployment rate, payrolls numbers, inflation data, etc., when you’re going to leave the LFPR dangling out there like some economic piñata for conservatives to bludgeon month after month? Not on my watch!
Below is a chart of the the government-reported LFPR (blue line) and what I think a proper fudging – under my leadership – would look like (red line). And yes, you’re damn right I want a new 35-year high. Why the hell not? What kind of nonsense is it to bring the unemployment rate down to 5.1 percent, print some 200,000 nonfarm payroll jobs per month, have most other numbers behaving very well, and leave the LFPR to languish?
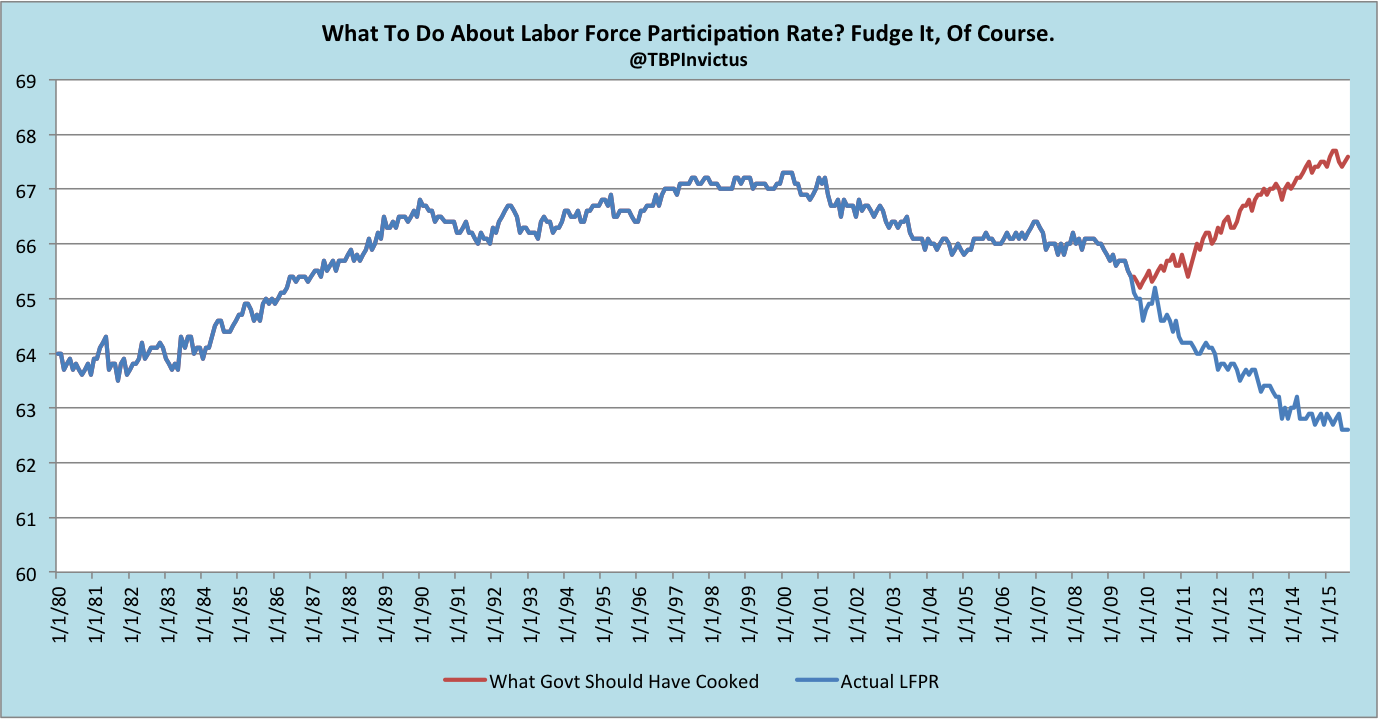
My commitment to the American people is both simple and straightforward: I will cook any and every number that needs to be cooked. We’ll see continued job growth, probably an unemployment rate under 2 percent. You also have my word that I’ll keep the LFPR above 66 percent. With a little help from my friends, we can probably run a surplus within a year or so, and pay down all our debt over the next decade or so. Nothing we can’t do with a little moxie and an Excel spreadsheet or two. (Jeb! – that 4% growth rate you’re pining for? Call me.)
Let’s get serious here – if you think the government is cooking all manner of economic releases, you need to explain the LFPR.
Previously on LFPR – See my fairly comprehensive May 2014 post on the issue here.

Invictus, I think I can simulate the conspiracy mind.
“LFPR is the one statistic they can’t fudge, and it proves that all the other numbers have been fudged.”
Note that it’s not necessary to prove the first half of the statement for people who think this way. Merely claiming to know “the truth” is all that’s necessary. After all, if all the good stats are fudged, then anything that isn’t good must be something that’s impossible to fudge. No other explanation need be considered.
If people are so happy with their situations in middle America, why are Trump and Sanders destroying the establishment candidates this far?
Trump has 20% of the 1/3 of GOP voters. Hillary is ahead of Sanders is national polls.
People don’t know the stats. The ardent always come out early for elections, remember Michele Bachmann? Herman Cain?
well there is happy. and then thee is happy. mainly its because the 99% has basically been ignored for over 2 decades now. and basically our incomes have shrunk. even while the 1% has taken more and more wealth for itself. and so we look for some one ‘new’ that isnt just trying to look like us (but failing all along the way). guessing we dont want plastic politicians. for now any way. its early
Obama is the reason that Baby Boomers have gotten eight years older and started to retire and draw Social Security.
That would never have happened under McCain or Romney!
yeah they would have cut social security to keep them from retiring. not that any body has had to work hard to stop them, cause with their ‘savings’ (401ks) having been trashed just a few short years ago, they havent been able to recover just yet
@Invictus How do you feel about methodology changes in reporting? Are people conflating that with cooking the numbers? Is it the same thing?
I am no expert on payrolls and inflation, but I do know that numbers reported by USDA on things like crop supply demand (aka the “crop report”) have had large enough methodology changes in the last 6 years that they are not apples to apples comparisons to the same reports in the same format from 15 years ago.
If I am not mistaken, changes to methodologies and reporting are typically accompanied by (sometimes rather lengthy and complex) technical notes explaining said changes. I am not an expert on such things (data sampling, collection, methodologies, etc.), and can only trust that the changes to which you refer are undertaken in a transparent and forthright manner.
They are usually reported in a transparent manner, but I have never seen an agency like BLS publish a data series of “this is what unemployment would look like if the 2005 methodology were applied to all years.”
In practice this is problematic because if you are a researcher / reporter who needs to publish a chart of unemployment you go to the BLS and download the data series. If you don’t also download the methodology papers and correct for changes in the way it was calculated, then you don’t have an apples to apples comparison from pre and post change. Correcting for the changes is probably so onerous that I feel certain everyone uses non-corrected data series.
I agree with your assertion on LFPR. However, I was a lowly banking analyst in 2008 and IIRC there was a change in the way LFPR was calculated that significantly reduced the number of people counted as “unemployed” by moving them to the “unemployable” and “no longer looking” buckets. Unemployment is basically “unemployed” / “employable AND looking.” The change lowered the total number of unemployed relative to the people who are employable because it leaves the denominator, employable, the same while reducing the unemployed number. The net effect is making unemployment look better and LFPR look worse.
I will say this: Any time – indeed every time – I have had questions about various data sets, changes, etc., I have found the folks at Census, BLS, BEA, et. al. extremely helpful. If you are seriously interested in pursuing the changes you describe, I would recommend giving them a call.
Shadowstats has tried to do that comparison: http://www.shadowstats.com/
I think the general consensus is that many of the BLS modifications over time have been valid statistical methodology corrections and so the Shadowstats comparisons overstate the negative of many of the statistics significantly. The “truth” may lie somewhere in between, but is probably usually tilted much more towards the BLS approach.
It is always interesting to look at the Shadowstats data to use when trying to evaluate historic conditions in markets and economies as a statistical number from today may not be a truly apples to apples comparison with a statistic from 40 years ago. Just because an employment stat is the same numerical value today as 40 years ago doesn’t necessarily mean that employment conditions are actually perfectly similar. The Shadowstats analysis does help to tease out a bit of that.
These reports adjust data going backward. If you are going to complain about Obama conspiracies, please include the older numbers
If you crazy Republicans MUST continue to only count landlines as phones you will get “Karl Roved Live on Fox” over and over.
Here is another disaster that Obama has created. Apparently he has been unable to create a large population of people willing to work at the wages that companies want to pay, so there is a record number of job openings:
http://www.marketwatch.com/story/job-openings-surge-to-new-record-of-575-million-in-july-2015-09-09
Record US Corporate Profits
https://research.stlouisfed.org/fred2/series/CP
Everbody is printing this: The latest Job Openings and Labor Turnover Survey showed that job openings jumped to 5.75 million in July, the highest ever…”
http://www.businessinsider.com/job-openings-and-labor-turnover-survey-september-9-2015-9
Record US disposable income
http://bea.gov/newsreleases/national/gdp/gdpnewsrelease.htm
Record GDP
http://www.cbsnews.com/news/gdp-economy-surged-at-3-7-percent-rate-in-april-june-quarter/
Fed needs to slow the economy it is in sustainably hot. We need to raise taxes too.
The Republicans need to do one of those deep Japanese bow apologies to Obama, Hillary Clinton, and the American people.
No worries. Everyone will have a job creating the world’s largest skatepark spanning the entire 3,145 kilometer Mexico border from San Diego, CA to Brownsville, TX.
That is nothing compared to the massive elevated cross-country ski trail that will be built on the 4,000 mile long Canadian border.
well it is hard to get a phd with 20 years experience in most fields to want to work for minimum wage. but companies want that. and so far they havent got what they wanted. course they also want people to buy what they sell. and for some reason that has been really hard to do
That’s what H1-B’s are for. hence unlimited H1-B’s and TPP.
If the job market is really so great then HR and recruiters would be offering free BJ’s to applicants.
I imagine they measure “job openings” by how many ads there are for jobs. Unfortunately, job ads don’t actual correlate with available jobs.
Also, the lack of applicants might correlate to the way companies have changed their hiring practices. Compared to 1990’s the hiring process has become more unpleasant and frustrating experience. Who wants to run the gauntlet of interviews (interrogations) and other rigmarole that has become the job hunting process in 2015?
One last thing. Have you seen some of the ads for jobs lately? The qualifications they ask for are discouraging to the normal applicant, which means the only people applying are the Dunning-Krugrer crowd.
We will need AT LEAST a couple million of those Syrian refugees to even get a third of those American jobs filled building walls between us and Mexico and the newest GOP party plank, a wall between the US and Canada.
What does Trump propose your tax rate to be again?
Actually, you can just visit the parking lots at all of the Home Depots in the country and you can get enough labor to build it.
Clearly if the numbers don’t fit my narrative they must be doctored. No way my narrative could be wrong!!!