
@TBPInvictus here.
Since the economy’s been more or less chugging along like The Little Engine That Could, those with an agenda are having a harder and harder time finding ways to be critical of its performance under Obama.
Two of their favorite laments are the Labor Force Participation Rate (LFPR) and the U-6 Unemployment Rate.
What is probably my most comprehensive piece on the LFPR is here, published in May 2014. Bill McBride, over at Calculated Risk, has also done some work on this file (see here and here). (Bill is one of the best economic bloggers out there, and I have a ton of respect for his work and am thrilled to have gotten to know him a bit over the years.) LFPR out of the way, let’s move on.
U-6 is a comprehensive measure of unemployment that goes beyond the headline (U-3) number. For the record, BLS has several such measures. Here they are:
- U-1, persons unemployed 15 weeks or longer, as a percent of the civilian labor force;
- U-2, job losers and persons who completed temporary jobs, as a percent of the civilian labor force;
- U-3, total unemployed, as a percent of the civilian labor force (this is the definition used for the official unemployment rate);
- U-4, total unemployed plus discouraged workers, as a percent of the civilian labor force plus discouraged workers;
- U-5, total unemployed, plus discouraged workers, plus all other marginally attached workers, as a percent of the civilian labor force plus all marginally attached workers; and
- U-6, total unemployed, plus all marginally attached workers, plus total employed part time for economic reasons, as a percent of the civilian labor force plus all marginally attached workers.
U-3, as mentioned above, is the “headline” number that most media outlets pick up on. Or at least they did, until it started to decline precipitously (it’s now 5%) and they turned to U-6 to advance their dystopian vision about how Obama has ruined everything.
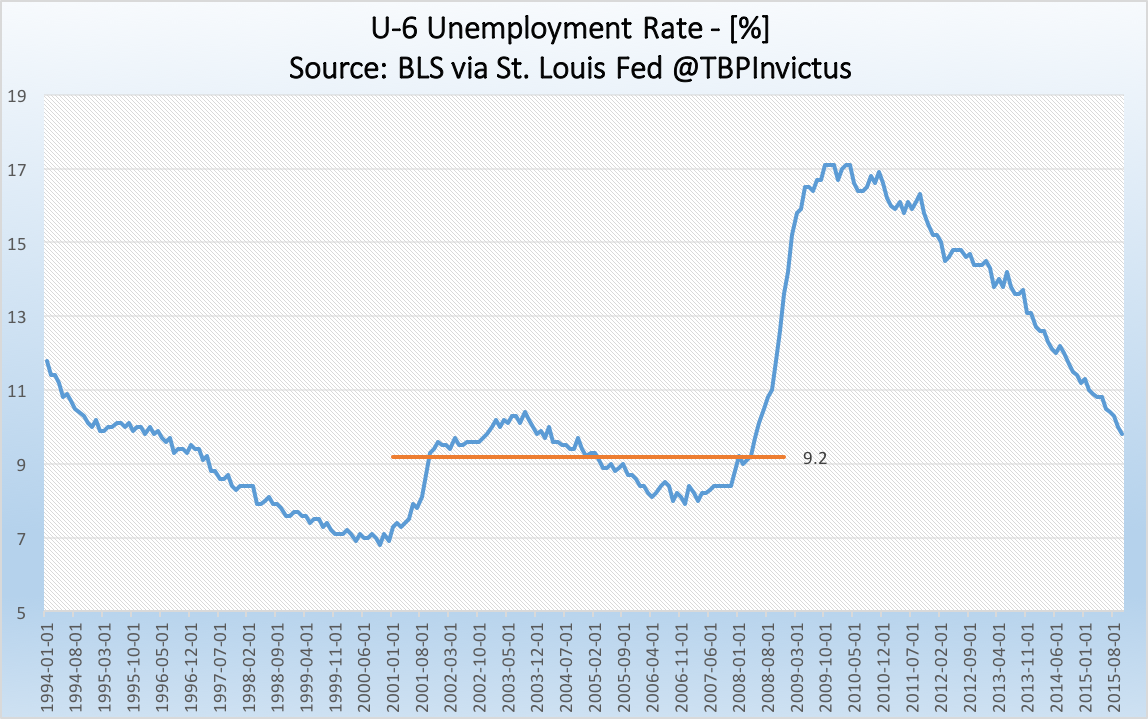
The more inclusive U-6 rate clocked in most recently at 9.8%. However, in a vacuum, with no context, that number by itself is of limited (or no) value. The fact of the matter is that it’s now down to 9.8% from a high of just over 17% shortly after the crisis.
But wait, there’s more.
Remember the so-called “Bush Boom”? (Well, neither do I, but supposedly it happened.) Anyway, during Bush’s two term presidency, U-6 averaged 9.2%. That’s correct. After a shallow recession in 2001, from which we got virtually no recovery whatsoever, U-6 was at or over 10% for 11 consecutive months from January through November 2003, not finally getting under 10% for good until April 2004.
I don’t recall Rick Santelli saying a single word about that. Rick, were you on CNBC during that stretch?
The labor market continues to heal, and that’s reflected in a variety of employment releases. Those who continue to harp on U-6 and/or the LFPR are really grasping at straws at this point.

I think this and the previous post are exactly why Fed will not be raising rates this year. U-6 is still above recession levels, and there is still no sign of the inflation fairy. Plenty of slack in wages.
Show me on the picture where the Bad Obummer Man hurt you………. Hmmm, not seeing it.
It is probably fair to say that the employment picture isn’t all ponies and unicorns now — it would be better if U6 was down around 8.5 certainly. But all the right-wing yammering about how everything is phony is just nonsense. Not that they care.
U-X of all varieties over state employment, U-3 in particular rose when extended UE payments were nipped.
What should be considered, as with any point estimate, is quality [broader term]. Employment quality in, other than those which entice illegals, is dismal.
A sad real read on US employment:
http://mobile.nytimes.com/2015/11/03/health/death-rates-rising-for-middle-aged-white-americans-study-finds.html?referer=&_r=0
That finding was reported Monday by two Princeton economists, Angus Deaton, who last month won the 2015 Nobel Memorial Prize in Economic Science, and Anne Case. Analyzing health and mortality data from the Centers for Disease Control and Prevention and from other sources, they concluded that rising annual death rates among this group are being driven not by the big killers like heart disease and diabetes but by an epidemic of suicides and afflictions stemming from substance abuse: alcoholic liver disease and overdoses of heroin and prescription opioids.
“It is difficult to find modern settings with survival losses of this magnitude,” wrote two Dartmouth economists, Ellen Meara and Jonathan S. Skinner, in a commentary to the Deaton-Case analysis to be published in Proceedings of the National Academy of Sciences.
“Wow,” said Samuel Preston, a professor of sociology at the University of Pennsylvania and an expert on mortality trends and the health of populations, who was not involved in the research. “This is a vivid indication that something is awry in these American households.”
In your quote of the day, you cited Max Planck, who said that “Science advances one funeral at a time.” Later in life, he was said to have added: “… Economics is not so fortunate.”
U6 is one of those zombie numbers that keeps coming back to life every time someone has an axe to grind.
One chart alone does not tell the whole story.
Might want to head over and take a look at a post by D. Stockman today and see what this means for the overall job economy.
Have a good day.
Read the two first words of the headline again. Why would you want us to go and waste our time with the babblings of some hyperventilating clown who cherry-picked an irrelevant parameter, just so he could mastrubate to his own favorite narrative?
Sadly there Dude – it is comments like yours that have caused me to read Ritholz but very rarely post anything to start a DISCUSSION here anymore – ad hominem attacks on this site have just been pathetic of late.
rj,
If you read your own posting you might just see an “attitude”. My attitudes are not nearly as covered up, but attitude is attitude. Have a great day.
The thing about economics is that it provides a wonderful playground for those who make up their reality/narratives before looking at the data. There are so many varieties of economic data that if you are simply looking for a number in support of your narrative, you will almost certainly be able to find one. There are probably at least 100 official numbers that can be interpreted as saying something about employment – so by pure chance at least a few will be below/above normal. The Bots on Fox show their scientific illiteracy and/or deliberate misinformation by the way they deal with these numbers. However, with the low information viewers they score a hit – and their business keep trucking.
It seems pretty clear that Obama will hand the next President an economy with close to full employment and rather fixable problems. That is a heck of a lot better than what could be said about his predecessor.
Here’s my favorite graph of Obama’s presidency:
https://research.stlouisfed.org/fred2/graph/?g=2ruS
Obama took office on January 20th, 2009 with layoffs still accelerating from the Great Recession inherited from President Bush. After March of 2009 (only two months later), the rate of layoffs took a U turn. It is an unbelievable graph of success.
Yes with the passage of the stimulus package, panic stopped and the seeds of recovery had been sown.