
Source: NYPD
Now that the political conventions are in full throat and the silly season has started, I thought it might be time for a reminder about reality.
In particular, the use and abuse of statistics, and the many ways people ignore data.
I was reminded of this last week in Missouri at the annual conference of the Missouri Association of Public Employee Retirement Systems (MAPERs), where I gave a presentation on misunderstanding risk. Before my speech, I had been speaking to a lot of current and retired police officers. Given all of the awful headlines news, they were concerned about an increase in violence generally and violence directed at cops specifically. They were quite surprised that while the headlines were screaming one thing, the data were saying something very different. Not only has violent crime been in decline, but the number of police fatalities also has been falling steadily for decades;data reveal that the past eight years has seen record-low numbers of officers killed in action (assaults on officers are down as well).
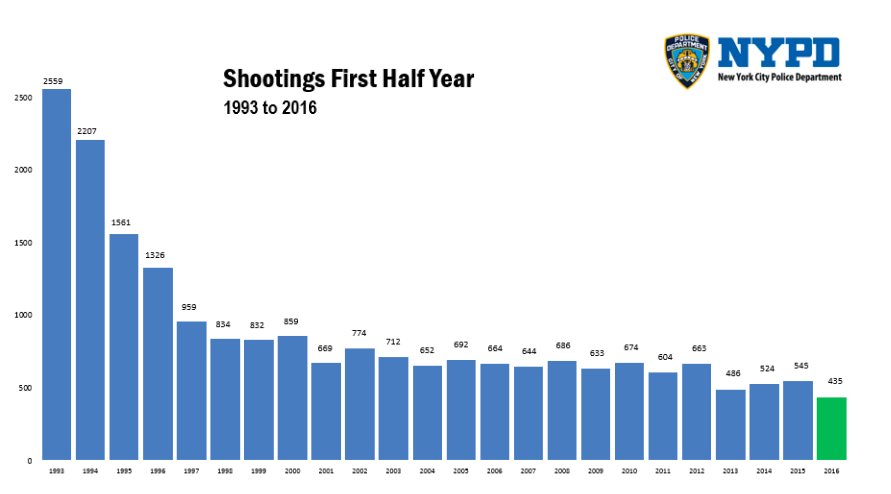
The drop in murders and violent crime is a national trend. Azi Paybarah, a reporter for Politico, pointed out that New York has had the fewest shootings on record in this year’s first half. The Washington Post noted that “compared to the first half of 1993, near the city’s crime peak, Donald Trump’s hometown has seen a 76.8 percent drop in violent crime and an 83 percent drop in murders.” That is hardly a picture of criminals running amok, at least in New York. (You can see earlier years of police data at New York City’s website; here is the FBI’s Uniform Crime Reports).
But it is more than just a record low in violent crime in the nation’s biggest city. According to the FBI’s database, crime nationwide has fallen to lows not seen in generations. Whether you compare present crime rates to the peak of murders in the 1970s or to the highs in violent crime in the 1990s, per capita crime rates are low and in long-term decline.
There are parallels to the economy and policy issues, as well as investing.
Here is another example: David Stockman, the former director of the Office of Management and Budget under President Ronald Reagan, showed a scary chart of bank write-offs of loans to businesses. The loan charge-offs were, in his words, “soaring again,” and appeared to be accelerating at the fastest rate since the financial crisis and to a level that was obviously recessionary.
Steven Saville at the Speculative Investor was having none of it. He noted that Stockman showed a “percentage change of a percentage” instead of a more appropriate “percentage change of a number.” What Stockman did was make a small increase look like a huge surge:
For example, an increase from 1% to 2% over the course of a year in the proportion of loans charged-off would be a 100% increase if expressed as a year-over-year percentage change in the percentage of charge-offs, whereas all you’ve actually got is a 1% increase in the total proportion of loans that have been charged-off.
Looking at the data correctly — year-over-year changes in write-offs of business loans — reveals something very different: A slight rise that in no way suggests the U.S. is either in or on the verge of recession.
In a similar vein, I have discussed what a radical tax cutting policy has done to the state of Kansas: The deficit has ballooned, economic growth has stagnated and spending on education and road maintenance has been slashed. Companies have moved a few miles across the border to better managed states. Indeed, Kansas has failed to keep up with the rest of the country’s employment growth.
But you wouldn’t know any of that if you relied on the statistics cited by Rex Sinquefield, who called Kansas “An Unsung Hero For Economic Growth” in Forbes.
Referring to Governor Sam Brownback’s elimination of the state income tax, Sinquefield wrote that Kansas’s “unemployment rate stands at 3.7% – the lowest the state has seen since 2001, and well below the national average of 5.5%.”
That seems impressive, until you provide some context. How has the unemployment rate been doing since the tax cuts were implemented? The answer is it has lagged the overall fall in the nation’s unemployment rate. Since Brownback’s tax cuts took effect in May 2012, Kansas’s unemployment rate has fallen 2 percentage points compared to a 3.3 point decline for the U.S.
For investors, the lessons are clear: You need to protect your portfolio with eternal vigilance against misleading statistics, numbers without context and data massaged in the service of ideology.
Originally: Soaring Crime, Bad Loans and Misleading Numbers
