
Via Meb Faber’s Idea Farm, comes this chart of a somewhat obscure technical indicator, the Coppock Curve.
Ned Davis Research has the specifics:
“After nearly two years of flat market action at the third highest level of valuation in history, next to 1929 and 2000, the Coppock Curve turned positive this month, prompting enthusiasm among some market technicians. Though we don’t use the Coppock indicator in its popular form, the 29 signals in this measure since 1900 have been associated, on average, with market returns of 19.6% over the following year, and only 3 yearly losses among those signals (one because of the entry into World War II, and the others because the signals were driven by the reversal of a very weakly negative reading, as was the case for the latest signal). The chart below shows this history. The very light purple line is the Coppock curve, and positive signals are identified by the vertical green lines.”
Interesting stuff.
Coppock Curve: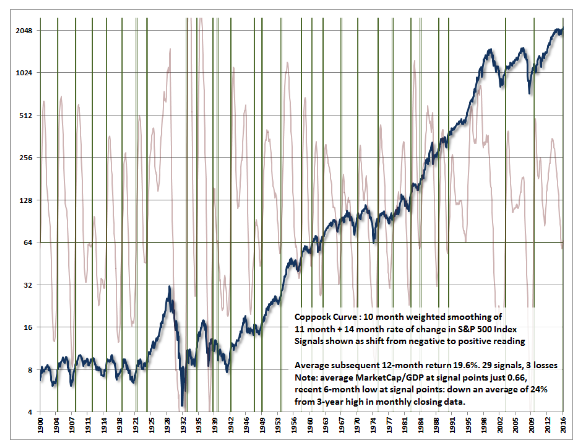
Source: Hussman Funds h/t The Idea Farm

What's been said:
Discussions found on the web: