
Below is one of my favorite housing charts, courtesy of Calculated Risk. It gives some people fits, but the explanation is very simple:
Home buying follows a very distinct annual cycle, relating to several factors, but mostly the calendar school year (September to June) and the weather. Parents shopping for a new home know it is less disruptive for their kids to change schools at the start of a new grade then mid-academic year.
Lots of folks seem to have a hard time grasping this; I recall trying to explain this to reporters/editors early in the housing crash — see links below — but understanding basic statistics and data seasonality did not seem to be a course given at J-School. There is also the issue of throwing newbie economics reporters right into the thick of this with little training in the math side of things.
Reporting on economic issues has improved since the crisis, although these days, the recurring cry is “nothing matters.” That may be true in matters of politics (at least for now), but investors who try to play that game find it to be both foolish and expensive.
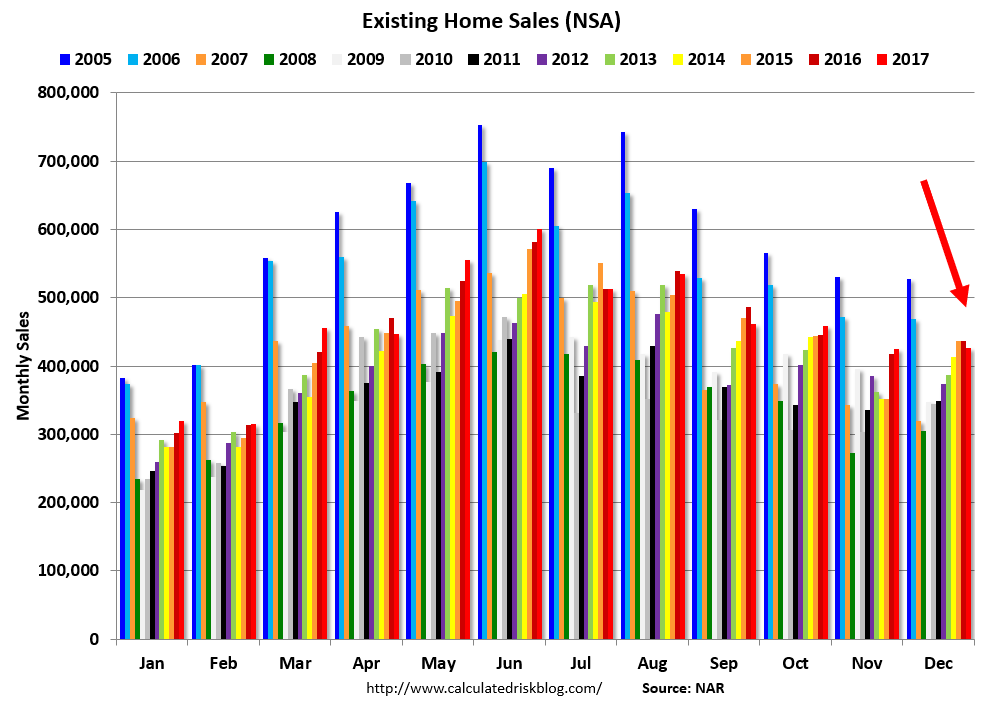
Source: Calculated Risk
Previously:
Revisiting Housing Seasonality & the Perennial Bottom Callers (July 28, 2008)
Existing Home Sales Fall 4.6% (March 23, 2009)
The Annual Existing Home Sales MSM Errata (March 24, 2009)
