
Words from the (investment) wise for the week that was (December 8 – 12, 2008)
Despite a litany of bleak economic and corporate news confronting investors during the past week, global stock markets digested the bearish fodder with a sense of aplomb. The MSCI World Index and the MSCI Emerging Markets Index gained 4.4% and 10.9% respectively on the week, with other reflation trades such as gold (+9.1%) and oil (+20.4%) also putting in a strong performance.
But investor angst was never completely allayed as seen from the yields on US one- and three-month Treasury Bills briefly trading in negative territory for the first time since 1940, indicating the willingness of risk-averse investors to pay the government for the “privilege” of holding their money. Three-month T-Bills ended the week in positive territory but barely so at a minuscule 0.036% yield, indicating that liquidity was still being hoarded. (Also see my “Credit Crisis Watch“.)

Source: Nick Anderson, Slate
The week kicked off on a positive note after US president-elect Barack Obama had spelled out his plans on Sunday for the biggest infrastructure investment in the US since the 1950s. According to CNN, Obama said: “We understand that we’ve got to provide a blood infusion to the patient right now to make sure that the patient is stabilized. And that means that we can’t worry short term about the deficit [which might surpass $1 trillion before his spending plans are included]. We’ve got to make sure that the economic stimulus plan is large enough to get the economy moving.”
“The resultant infrastructure and physical assets will be far better than endowing busted banks, insurance companies and other financial entities with US taxpayers’ cash, which effectively goes down a black hole,” remarked Bill King (The King Report).
Financial markets reacted negatively to the US Senate’s failure to agree on a $14 billion loan to the troubled automakers. The prospect of the biggest industrial failure in US history caused a sell-off on global stock markets, a widening of credit spreads and an onslaught on the US dollar.
However, the US Treasury was quick to signal its readiness to provide funds to prop up the “Big Three”, as quoted in the Financial Times: “Because Congress failed to act, we will stand ready to prevent an imminent failure until Congress reconvenes and acts to address the long-term viability of the industry.” This indication resulted in an improved tone on financial markets by the close of the week.
Next, a tag cloud from the plethora of articles I have devoured over the past week. This is a way of visualizing word frequencies at a glance. Key words such as “credit”, “debt”, “economy”, “Fed”, “government”, “market”, “rates” and “stock” occur often, but “gold” is also becoming increasingly prominent.

Back to the issue of markets shrugging off bad news for the second week running. Richard Russell (Dow Theory Letters) commented as follows: “On top of everything else, Lowry’s Selling Pressure Index dropped substantially yesterday [Wednesday] and is now in a definite declining trend. At the same time, Lowry’s Buying Power Index is trending higher. Thus, the odds are saying that the trend of the stock market is turning up.
“This is all the more dramatic since this potential upturn has arrived in the face of black-bearish news. Markets bottoming and rising in the face of bearish news are often the most profitable ones. I have never seen a bear market hit its low amid happy news headlines.”
On a fundamental note, 39% of the constituents of the MSCI World Index sell at a discount to shareholders’ equity. “The cash-rich companies allow investors to pay nothing for future earnings streams,” said Jean-Marie Eveillard in an interview with Bloomberg.
A positive for the bulls is that the period post Thanksgiving through the end of the year has usually been a bullish time for stocks, based on studies by Jeffrey Hirsch (Stock Trader’s Almanac). Should the bullish seasonal tendencies provide a tailwind on this occasion, possible first targets are the 50-day moving averages of 8,784 for the Dow Jones Industrial Index (current level 8,630) and 910 for the S&P 500 Index (current level 880).
The last word on equities goes to Hong Kong-based Puru Saxena: “I cannot say with any certainty whether we are already in the early stages of the next cycle. Under my best case scenario, we are in the very early stages of a new multi-year bull market. And under my worst case scenario, we are going to get a very strong rebound (30% move higher in the S&P 500) over a short period of time, which will probably take the markets back to their 200-day moving averages.”
Before highlighting some thought-provoking news items and quotes from market commentators, let’s briefly review the financial markets’ movements on the basis of economic statistics and a performance round-up.
Economy
“Global business confidence has been shattered. Sentiment is equally negative in North America, South America and Europe. Asian business confidence is not quite as dark, but it is falling rapidly,” said the latest Survey of Business Confidence of the World conducted by Moody’s Economy.com. “Pricing power is quickly evaporating and approaching that which prevailed in 2003, the last time deflation was a concern.” According to the survey results, the global economy is suffering a severe recession.
Economic indicators released in the US during the past week mostly pointed to a deepening recession.
BCA Research said: “The year-end spending season will be the biggest bust in several decades, as consumers have been hit by a double whammy: a meltdown in financial and residential asset prices; and a sharp rise in layoffs. The government’s failure to deliver a fiscal stimulus plan and unfreeze the credit markets imply that the recession will deepen and any recovery will be pushed farther into the future.
“The contraction in payrolls and economic growth will persist until there are some signs that policy actions are finally becoming effective. The fiscal stimulus plan needed to stabilize the economy will be massive and policy rates will stay near zero for a long time.”
The precarious position of the US consumer is illustrated by a plunge of 21.9 points to 63.7 in the annual average of the University of Michigan Consumer Sentiment Index – the largest annual average decline in the history of the Index which began in 1952, according to Asha Bangalore (Northern Trust).

The Fed fund futures are pricing in a 76% chance of a 75 basis-point cut in rates from 1.0% to 0.25% when the FOMC meets on December 16.
However, Bill King questioned the Fed’s approach: “[Effective] Fed funds traded at zero late last night. We have screamed for months that the official or ‘target’ Fed funds rate was irrelevant because the effective funds rate was much lower, and near zero. Now Fed funds are trading at zero. Yet there will be pundits and experts that will assert that the Fed might cut its target funds rate this week to 0.50% or even 0.25% – even though the cut in the target rate is meaningless. Now that the Fed is paying interest to banks, why did the Fed allow the funds rate to trade at zero? Yep, they are terrified by something.”
Also, the Fed is considering issuing its own debt to further expand money supply without clogging up bank balance sheets and making it harder for the Fed to maintain interest rates at the desired level. RGE Monitor said: “… there are upper limits to Treasury issuance and lower limits to the amount of Treasuries the Fed can sell off from the asset side of its balance sheet. One hurdle to issuing Fed bills: The Federal Reserve Act doesn’t explicitly permit the Fed to issue notes beyond currency.”

Elsewhere in the world, economic reports compounded anxiety about a severe global recession. Specifically, Chinese exports in November declined by 2.2% from a year earlier as a result of a drastic slowdown in demand in many of its main markets. The figures were far below forecasts and the +19% figure for October. “This is the worst collapse in Chinese exports since 1999 and is probably just the beginning of a prolonged export contraction,” said Isaac Meng, economist at BNP Paribas, as reported by the Financial Times.
Week’s economic reports
Click here for the week’s economy in pictures, courtesy of Jake of EconomPic Data.
|
Date |
Time (ET) |
Statistic |
For |
Actual |
Briefing Forecast |
Market Expects |
Prior |
|
Dec 9 |
10:00 AM |
Pending Home Sales |
Oct |
-0.7% |
– |
-3.0% |
-4.3% |
|
Dec 10 |
10:00 AM |
Oct |
-1.1% |
-0.2% |
-0.2% |
-0.4% |
|
|
Dec 10 |
10:35 AM |
Crude Inventories |
12/06 |
392K |
NA |
NA |
-456K |
|
Dec 10 |
2:00 PM |
Nov |
-$164.4B |
NA |
-$171.0B |
-$98.2B |
|
|
Dec 11 |
8:30 AM |
Export Prices ex-agriculture |
Nov |
-2.9% |
NA |
NA |
-1.3% |
|
Dec 11 |
8:30 AM |
Import Prices ex-oil |
Nov |
-1.8% |
NA |
NA |
-0.9% |
|
Dec 11 |
8:30 AM |
12/06 |
573K |
520K |
525K |
515K |
|
|
Dec 11 |
8:30 AM |
Oct |
-$57.2B |
-$53.5B |
-$53.5B |
-$56.6B |
|
|
Dec 12 |
8:30 AM |
Core PPI |
Nov |
0.1% |
0.1% |
0.1% |
0.4% |
|
Dec 12 |
8:30 AM |
Nov |
-2.2% |
-2.1% |
-2.0% |
-2.8% |
|
|
Dec 12 |
8:30 AM |
Nov |
-1.8% |
-2.1% |
-2.0% |
-2.9% |
|
|
Dec 12 |
8:30 AM |
Retail Sales ex-auto |
Nov |
-1.6% |
-1.9% |
-1.8% |
-2.4% |
|
Dec 12 |
10:00 AM |
Oct |
-0.6% |
0.0% |
-0.2% |
-0.4% |
|
|
Dec 12 |
10:00 AM |
Mich Sentiment-Preliminary |
Dec |
59.1 |
58.0 |
55.0 |
55.3 |
Source: Yahoo Finance, December 12, 2008.
In addition to interest rate announcements by the FOMC (Tuesday) and the Bank of Japan (Thursday), next week’s US economic highlights, courtesy of Northern Trust, include the following:
1. Industrial Production (December 15): The 1.4% drop in the manufacturing man-hours index in November suggests a 1.0% decline in industrial production. The operating rate is projected to have dropped to 75.7. Consensus: -0.8%; Capacity Utilization: 75.7 versus 76.4 in October.
2. Consumer Price Index (December 16): A 0.7% decline in the CPI is forecast for November versus a 1.0% drop in October, reflecting largely lower energy prices. The core CPI is expected to have moved up by 0.1% after a 0.1% decline in October. Consensus: 1.3%, core CPI +0.1%.
3. Housing Starts (December 16): Permit extensions for new homes fell by 9.2% in October, inclusive of a 12.6% drop in permits issued for single-family homes. These figures suggest a sharp drop in housing starts (730,000). Consensus: 740,000 versus 791,000 in October.
4. Leading Indicators (December 18): Interest-rate spread and money supply are the only two components likely to make a positive contribution in November. Stock prices, initial jobless claims, manufacturing workweek, consumer expectations, vendor deliveries, and building permits are expected to make negative contributions. Forecasts of money supply and orders of consumer durables and non-defense capital goods are used in the initial estimate. The net impact is a 0.5% drop in the leading index during November, assuming building permits fell. Consensus: -0.5 %
5. Other reports: NAHB Survey (December 15), Current Account (Q4) (December 17), Philadelphia Fed Survey (December 18).
Click here for a summary of Wachovia’s weekly economic and financial commentary.
Markets
The performance chart obtained from the Wall Street Journal Online shows how different global markets performed during the past week.

Source: Wall Street Journal Online, December 12, 2008.
Equities
Global stock markets rallied strongly during the past week as bargain-hunters looked past the grim economic and corporate reports. Both mature and emerging markets participated in the rally, as shown by the gains of the MSCI World Index (+4.4%) and the MSCI Emerging Markets Index (+10.9%). Notwithstanding the improvement, these indices were still down by 47.4% and 58.8% respectively since the peaks of October 2007.
Particularly noteworthy, the MSCI Emerging Markets Index has been outperforming the Dow Jones World Index since late October (rising green line), after a period of solid underperformance from May to October (falling line).

The chart below shows the performance of the four BRIC countries since the November 20 lows. Brazil (orange line), India (green) and Russia (red) have all recovered sharply, but China (blue) has underperformed after initial outperformance following the climactic[MR2] November 10 sell-off.

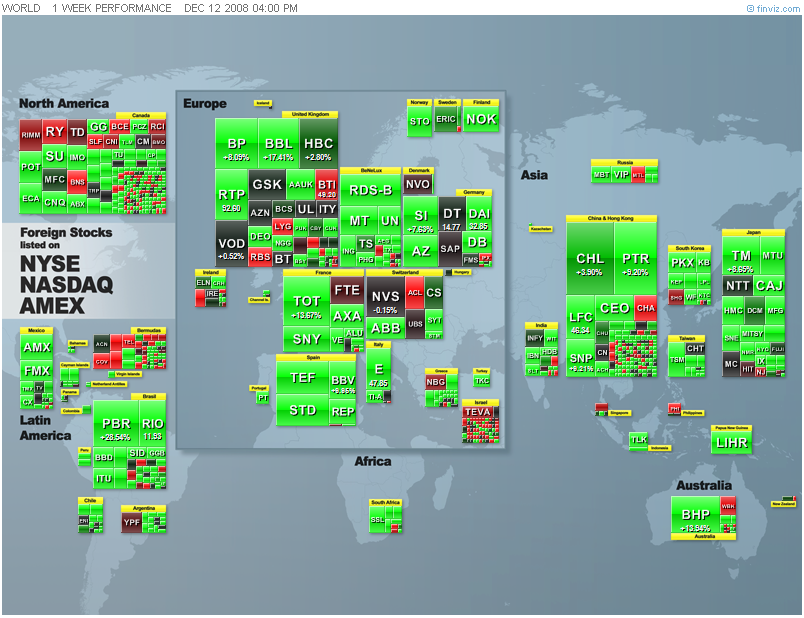
Click here or on the thumbnail below for a (pleasantly green) market map, obtained from Finviz, providing a quick overview of last week’s performances of global stock markets (as reflected by the movements of ADR stocks).
The Dow Jones Industrial Index was one of the few major indices to record a negative return during the past week, with US markets in general lagging other bourses as shown by the major index movements: Dow -0.1% (YTD -34.95), S&P 500 Index +0.4% (YTD -40.1%), Nasdaq Composite Index +2.1% (YTD ‑41.9%) and Russell 2000 Index +1.6% (YTD -38.8%).
The bar chart below shows the US sector performances over the week, and specifically how strongly energy and materials have recovered. Nine of the ten best-performing groups were related to commodities (diversified metals & mining, coal & consumable fuel, aluminum, steel, gold, oil & gas drilling, oil & gas exploration & production, gas utilities[MR3] , and oil & gas equipment & services).

Jamie Dimon, JPMorgan Chase’s (JPM) chief executive, prompted a sharp fall in financial shares with a warning that his bank was having a tough fourth quarter after a “terrible” November and December. Goldman Sachs’ (GS) earnings report on Tuesday is keenly awaited.
Based on the outperformance of emerging-market stocks and the sharp recovery of commodity-related groups, it would appear that investors are becoming less risk averse. Another example is the outperformance of small caps since the November 20 lows. A study published by Bespoke on December 8 highlighted the decile performance of stocks in the S&P 500 Index based on market cap. As shown by the chart below, the two deciles of the largest-cap stocks in the S&P 500 increased by about 17%, while the decile of the smallest-cap stocks was 54% higher.

Fixed-income instruments
The yields on government bonds generally edged up during the past few trading days after a record-breaking plunge since the beginning of November.
The UK ten-year Gilt yield increased by 17 basis points to 3.60% and the German ten-year Bund rose by 26 basis points to 3.30%. Although the US ten-year Treasury Note yield declined by 7 basis points to 2.59% on the week, the yield edged up from an earlier five-decade low of 2.48%.

John Hussman (Hussman Funds) expressed his concern about the level of Treasuries: “The problem with Treasury yields here is that while there are good economic reasons for the downward yield pressures, the levels are low enough to invite explosive spikes that can easily wipe out a year or more of yield-to-maturity in a few days.”
Emerging-market bonds moved in an opposite direction to mature bonds, with the JPMorgan EMBI Global Index gaining 2.4% during the week.
US mortgage rates were almost unchanged on the week, with the 30-year fixed rate rising by 2 basis points to 5.71% and the 5-year ARM declining by 1 basis point to 5.95%
The CDX and iTraxx credit indices, US Treasury Bills and high-yield spreads are still at distressed levels. Some improvement has been seen as a result of the central banks’ actions, notably the tightening of the TED and LIBOR-OIS spreads, and lower mortgage rates. However, credit spreads need to narrow further to indicate that liquidity is moving freely again and credit markets are starting to thaw. (Also see my “Credit Crisis Watch“.)
Currencies
The US dollar fell sharply as the recent relationship between risk aversion and dollar strength weakened as a result of US-specific factors like the deterioration in the US trade balance and the automaker woes. The greenback plummeted to a 13-year low against the Japanese yen and touched its lowest level against the euro for seven weeks.
As shown by the chart below, the dollar has broken below its 50-day moving average and seems to be topping out. Are foreign investors coming to the conclusion that the US currency, which briefly last week yielded a negative yield, is no longer an attractive option?

Over the week the US dollar lost ground against the euro (-5.0%), the British pound (-1.8%), the Swiss franc (-3.6%), the Japanese yen (-1.8%), the Canadian dollar (-2.0%), the Australian dollar (-3.0%) and the New Zealand dollar (-2.2%). The US currency also fell against emerging-market currencies[MR4] , like the South African rand (-2.0%).
The British pound came under renewed pressure as the worsening economic situation triggered concerns of a currency crisis. Sterling’s trade-weighted index fell to its lowest level since record-keeping began in 1981.
Commodities
The Reuters/Jeffries CRB Index (+8.8%) closed higher by the end of the week – only its sixth positive week since commodities peaked early in July. The Baltic Dry Index – a benchmark for shipping major raw materials including coal, iron ore and grain – bounced by 15.2% from very oversold levels.
The graph below shows the movements of various commodities over the past week, indicating an improvement across the whole complex (with the exception of natural gas) as a weak US dollar pushed prices higher.

The International Energy Agency urged a “substantial” cut in Opec output when the oil cartel meets next week, as global oil demand this year is expected to contract for the first time in 25 years. The price of West Texas Intermediate crude surged by 20.4% in expectation of a cut of at least 1 million to 1.5 million barrels a day.
Gold bullion (+9.1%) remained in favor with investors as a result of a solid supply/demand situation, store-of-value considerations and a weaker US currency. The chart below illustrates the strong inverse relationship between gold (green line) and the dollar (red line). In addition, gold has broken above its 50-day moving average (blue line) and trades at about the same level it started off in January 2008 – quite a feat in these difficult markets. Platinum (+4.9%) and silver (+8.5%) improved in tandem with the yellow metal.

After the storm comes the calm. With only 12 more trading days remaining before we wish the tumultuous 2008 goodbye, let’s hope the calm lies just ahead. And as Richard Russell reminds us: “Calm after a bearish trend is usually bullish.” Meanwhile, the news items and words from the investment wise below will hopefully assist in steering our portfolios on a profitable course.
That’s the way it looks from Cape Town.

Source: Dave Granlund
YouTube: The twelve days of bailouts
A bailout song for the holidays.

Source: YouTube, December 6, 2008.
New York Magazine: Oracles of doom
They always knew the economy would collapse. What do they think will happen next?
FORTUNE TELLER: Gerald Celente
Trends Research Institute founder; owner of collapseof09.com
TRACK RECORD
Predicted 1987 crash, 1997 Asian currency crisis; said in 2007 that US was headed for “economic 9/11” in 2008.
CURRENT PREDICTION
“Products are going to be cheaper to buy, but guess what? You’re going to need more dollars to buy them because your dollar’s going to be worth less. There is no fiscal or monetary policy that can save this. You cannot save it by printing more money.”
FORTUNE TELLER: Nouriel Roubini
NYU business professor; chairman of RGE Monitor
TRACK RECORD
Predicted this year’s crisis in 2006, pointing to a housing bust, oil shocks, and interest-rate increases.
CURRENT PREDICTION
“It’s becoming a global recession. I expect it to be the worst US recession of the last 50 years. I expect a cumulative fall in output from the peak of 4% and the unemployment rate going all the way to 9%.”
FORTUNE TELLER: Peter Schiff
President of Euro Pacific Capital
TRACK RECORD
Published “Crash Proof: How to Profit From the Coming Economic Collapse in February 2007”; star of YouTube video “Peter Schiff Was Right 2006-2007.”
CURRENT PREDICTION
“I predicted that the economy would collapse. The bigger risk I saw was the government’s attempt to solve the problem by doing exactly what they’re now doing. They’re going to create another Great Depression, but worse, because the cost of living will go through the roof.”
FORTUNE TELLER: Richard Russell
Founder of the Dow Theory Letters
TRACK RECORD
Predicted bottom of 1974 bear market; exited market before crashes in 1987 and 2000.
CURRENT PREDICTION
“As long as we can hold the Dow above 7,470, I think the situation is hopeful. That’s the halfway level from when the bull market started in 1982 and when it ended in 2007. My guess is that it will break that level. Most bear markets have wiped out more than 50% of a bull market.”
FORTUNE TELLER: Barry Ritholtz
CEO and equity research director of Fusion IQ; blogger at The Big Picture
TRACK RECORD
Predicted downturn last year.
CURRENT PREDICTION
“In March, the first-quarter numbers start coming out, and that’s potentially a problem. It’s just going to be an issue of dealing with the market. If earnings continue to drop and you end up with multiple contractions, that basically takes you to a really bad, ugly place, which is an S&P at 400 or 500. I don’t think that’s likely, but it’s certainly possible.”
FORTUNE TELLER: Jeremy Grantham
Co-founder and chairman, GMO LLC
TRACK RECORD
His 1998 ten-year forecast showed severe market declines in 2007 and 2008; warned of global bubble in April 2007.
CURRENT PREDICTION
“I would think, just to guess, that the period of heroic volatility will end pretty soon and will be replaced by a rather 1974-ish environment, where you quietly get bitterly resigned to your steady diet of bad news.”
Source: Jeff VanDam, New York Magazine, December 7, 2008.
CNBC: Merrill Lynch – outlook for 2009
“An economic and investment outlook for 2009, with Merrill Lynch’s Richard Bernstein and Davis Rosenberg.

Source: CNBC, December 11, 2008.
Financial Times: Obama to focus on stimulus not deficit
“Barack Obama on Sunday spelled out his plans for the biggest infrastructure investment in the US for half a century. The president-elect argued that with the economy reeling, his incoming administration could not afford to worry about a spiralling budget deficit.
“Mr Obama’s proposals for government works on roads, bridges, internet broadband and school buildings, together with energy efficiency measures and health spending, are far more detailed than the normal announcements during a time of transition.
“At a time of deepening economic gloom – with half a million jobs lost last month alone – president George W. Bush has been largely absent from the recent economic debate. Mr Obama is highlighting his concern at the depth of the recession he will inherit, while fast-tracking his plans to counter it.
“‘Things are going to get worse before they get better,’ Mr Obama said on Sunday on NBC’s Meet The Press. He emphasised that his plans represented the largest US infrastructure programme since the federal highway system in the 1950s.
“‘The key is making sure we jump-start the economy in a way that doesn’t just deal with the short term, doesn’t just create jobs immediately, but also puts us on a glide path for long-term sustainable economic growth.’
“Noting the US budget deficit might surpass $1,000 billion before his spending plans are factored in, Mr Obama added: ‘We understand that we’ve got to provide a blood infusion to the patient right now to make sure that the patient is stabilised. And that means that we can’t worry short term about the deficit. We’ve got to make sure that the economic stimulus plan is large enough to get the economy moving.’
“He wanted a strong set of financial regulations to make banks, credit ratings agencies, mortgage brokers and others ‘much more accountable and behave much more responsibly’.
“‘I am absolutely confident that if we take the right steps over the coming months that not only can we get the economy back on track but we can emerge leaner, meaner and ultimately more competitive and more prosperous,’ Mr Obama said at a subsequent press conference.”
Source: Daniel Dombey, Financial Times, December 7, 2008.
Bill King (The King Report): Obama Plan one of the better plans
“The Obama Plan to spend massive amounts of money on infrastructure in the US is one of the better plans being proffered to keep the US out of a depression. But it has its drawbacks.
“Other stimulus plans put money or entitlements in US consumers’ pockets. Most of the money ends up in China, Japan or OPEC. Most infrastructure spending will remain in the US. And instead of just passing out checks or larger entitlements, jobs, mostly temps, will be created and permanent assets will result.
“The resultant infrastructure and physical assets will be far better than endowing busted banks, insurance companies and other financial entities with US taxpayers’ cash, which effectively goes down a black hole.
“Obama’s Plan will boost blue collar employment, provided a limited number of illegals are hired. This will produce an income shift to blue collar and lower middle class households. But fired employees of financial, high tech and other high-end jobs are unlikely to participate. So the multiplier effect of increased income will be less on the economy in general.
“The negatives of the plan, besides the massive debt and likely corruption, is that it does not remedy structural problems in the US economy and financial system. There will be few new industries spawned and therefore few permanent well-paying jobs. Nothing addresses the savings and investment problems.
“There is too much capacity in the world. There are hundreds of empty or abandoned factories in China alone. Until excess capacity is scuttled and new industries appear, stable employment is a fantasy.
“The real problem, the one that solons will not address, is the US welfare state is busted. The Keynesian and monetary stimuli that were abused over many decades to paper over welfare state spending are now being escalated to an unsustainable degree in a last grand attempt to salvage the welfare state system.
“Like all state attempts to stave off a debt deflation by running the printing press and nationalization, it will likely result in a massive inflation that destroys the nation’s fabric and the financial assets of the upper middle class and elites. The middle and lesser classes have few financial assets.”
Source: Bill King, The King Report, December 9, 2008.
Financial Times: Treasury signals rescue for carmakers
“The US administration was on Friday scrambling to save Detroit’s troubled car industry, as General Motors said it was closing most of its North American manufacturing plants for the month of January in the wake of the Senate’s failure to agree a $14 billion loan for GM and Chrysler.
“The US Treasury signaled it was ready to step in with funds intended to prop up the financial system to prevent the biggest industrial failure in US history.
“‘Because Congress failed to act, we will stand ready to prevent an imminent failure until Congress reconvenes and acts to address the long-term viability of the industry,’ the Treasury said.
“GM’s bonds fell to a new low of 9-10 cents on the dollar on fears of a bankruptcy by America’s largest domestic carmaker, before recovering to 15 cents on the news that the Bush administration was looking for alternative financing.
“For weeks George W Bush, the US president, has resisted using the $700 billion troubled asset relief program to provide aid to the carmakers, arguing that such an interventionist step would be a misuse of funds.
“However, facing the prospect of the collapse of one or more of the Detroit companies, the White House indicated it had few other options. ‘A precipitous collapse of this industry would have a severe impact on our economy and it would be irresponsible to further weaken and destabilize our economy at this time,’ said Dana Perino, White House spokeswoman, specifically noting the possibility of using Tarp funds.
“A Chapter 11 bankruptcy filing by GM, the world’s biggest carmaker, would mark the biggest industrial failure in US history.”
Source: Daniel Dombey, John Reed and Bernard Simon, Financial Times, December 12, 2008.
Reuters: Fed mulls issuing own debt
“The US Federal Reserve is considering issuing its own debt for the first time, the Wall Street Journal said, citing people familiar with the matter.
“Fed officials have approached Congress about the move, which could include issuing bills or some other form of debt and would provide the central bank with more flexibility to tackle the financial crisis, the Journal said.
“The Fed can already print as much money as it wants, but issuing debt is largely the province of the Treasury Department.
“The Fed stepped in with emergency credit for investment bank Bear Stearns in March and insurer AIG in September, and threw open its direct loan window to Wall Street firms this year in a bid to stabilize financial markets amid a credit freeze.
“But with the credit crisis showing no signs of abating, and the narrow scope for further interest rate cuts from the present levels of 1%, economists expect the Fed to look at new ways to boost the supply and circulation of money to avoid a deflationary slump.”
Source: Reuters, December 10, 2008.
Paul Kasriel (Northern Trust): The credit rating on a benevolent counterfeiter’s debt – infinity A?
“Why would the Fed be contemplating issuing its own debt? To soak up in the future some of the massive credit the Fed has created in the past year or so. Why would the Fed not just sell US Treasury securities from its portfolio in order to soak up this excess Fed credit? Because, as shown in the chart below, the Fed’s outright holdings of US Treasury securities has dropped from a shade under $800 billion to about $475 billion as Fed credit outstanding has risen from a little over $800 billion to about $2.1 trillion. In percentage terms, the Fed’s outright holdings of US Treasury securities has gone from a bit over 90% of reserve bank credit outstanding to about 22-1/2%. The Fed is afraid it might run out of US Treasury securities to sell!

“I can see nothing sinister about all this. It is not a conspiracy to print money. Just the opposite. It is a way to destroy some of the paper the Fed already has ‘printed’.”
Source: Paul Kasriel, Northern Trust – Daily Global Commentary, December 10, 2008.
Bloomberg: Fed refuses to disclose recipients of $2 trillion
“The Federal Reserve refused a request by Bloomberg News to disclose the recipients of more than $2 trillion of emergency loans from US taxpayers and the assets the central bank is accepting as collateral.
“Bloomberg filed suit November 7 under the US Freedom of Information Act requesting details about the terms of 11 Fed lending programs, most created during the deepest financial crisis since the Great Depression.
“The Fed responded December 8, saying it’s allowed to withhold internal memos as well as information about trade secrets and commercial information. The institution confirmed that a records search found 231 pages of documents pertaining to some of the requests.
“If they told us what they held, we would know the potential losses that the government may take and that’s what they don’t want us to know,” said Carlos Mendez, a senior managing director at New York-based ICP Capital, which oversees $22 billion in assets.
“The Fed stepped into a rescue role that was the original purpose of the Treasury’s $700 billion Troubled Asset Relief Program. The central bank loans don’t have the oversight safeguards that Congress imposed upon the TARP.
“Congress is demanding more transparency from the Fed and Treasury on bailout, most recently during December 10 hearings by the House Financial Services committee when Representative David Scott, a Georgia Democrat, said Americans had ‘been bamboozled’.
Source: Mark Pittman, Bloomberg, December 12, 2008.
The Wall Street Journal: Mayors get in line for US funds
“Big-city mayors will arrive on Capitol Hill Monday to lobby for more federal spending to be funneled to urban areas that they say drive the country’s economic engine.
“The push comes after a strong Democratic turnout in metropolitan areas helped President-elect Barack Obama – who is set to become America’s first urban president in almost half a century – win by such a decisive margin in November.
“A delegation of mayors, including Michael Bloomberg of New York and Antonio Villaraigosa of Los Angeles, plans to ask the federal government to distribute funds directly to cities instead of going through state governments. The group is set to present a list of more than 4,600 infrastructure projects that they say are ‘ready to go’.
“Tom Cochran, executive director of the US Conference of Mayors, which is organizing Monday’s event, said the next administration has signaled that it will coordinate financing for projects for an entire metropolitan area instead of dealing with cities and suburbs separately.
“‘I am of the opinion, based on our conversations with President-elect Obama, that he gets it,’ said Mr. Cochran. ‘You can’t just have a transportation system that stops at the city line.’
“Mr. Obama’s transition office is drawing up plans to create a White House office on urban policy, which would report directly to the president, to coordinate funding for cities from different federal agencies. Mr. Obama has pledged to provide new funding for job training, education and grants for local governments and organizations.”
Source: T.W. Farnam, The Wall Street Journal, December 8, 2008.
Bloomberg: Interview with Martin Feldstein
“Harvard University professor Feldstein discusses auto bailout, how to fix the housing market as well as Fannie and Freddie, and 3-month T-Bill rates below zero.”

Source: Bloomberg (via YouTube), December 9, 2008.
Ambrose Evans-Pritchard (Telegraph): Deflation virus is moving the policy test beyond the 1930s
“Debt deflation is tightening its grip over the entire global system. Interest rates are creeping towards zero in Japan, America, and now across most of Europe.
“We are beyond the extremes of the 1930s. The frontiers of monetary policy are being pushed to limits that may now test viability of paper currencies and modern central banking.
“You cannot drop below zero. So what next if the credit markets refuse to thaw? Yes, Japan visited and survived this policy hell during its lost decade, but that was a local affair in an otherwise booming global economy. It tells us nothing.
“This time we are all going down together. There is no deus ex machina to lift us out. Certainly not China, which is the most vulnerable of all.
“As the risk grows, officials at the highest level of the British Government have begun to circulate a six-year-old speech by Ben Bernanke – at the time of its writing, a garrulous kid governor at the US Federal Reserve. Entitled ‘Deflation: Making Sure It Doesn’t Happen Here’, it is the manual of guerrilla tactics for defeating slumps by monetary means.
“‘The US government has a technology, called a printing press, that allows it to produce as many US dollars as it wishes at essentially no cost,’ he said.
“His point was that central banks never run out of ammunition. They have an inexhaustible arsenal. The world’s fate now hangs on whether he was right (which is probable), or wrong (which is possible).
“As a scholar of the Great Depression, Bernanke does not think that sliding prices can safely be allowed to run their course. ‘Sustained deflation can be highly destructive to a modern economy,’ he said.
“Bernanke’s central claim is that the big guns of monetary policy were never properly deployed during the Depression, or during the early years of Japan’s bust, so no wonder the slumps dragged on.
“The Fed can create money out of thin air and mop up assets on the open market, like a sovereign sugar daddy. ‘Sufficient injections of money will ultimately always reverse a deflation.’
“Bernanke said the Fed can ‘expand the menu of assets that it buys’. US Treasury bonds top the list, but it can equally purchase mortgage securities from US agencies such as Fannie, Freddie and Ginnie, or company bonds, or commercial paper. Any asset will do.
“The Fed can acquire houses, stocks, or a herd of Texas Longhorn cattle if it wants. It can even scatter $100 bills from helicopters. (Actually, Japan is about to do this with shopping coupons).”
Source: Ambrose Evans-Pritchard, Telegraph, December 9, 2008.
Asha Bangalore (Northern Trust): Household net worth is shrinking rapidly
“Household net worth in the third quarter of 2008 was $56.5 trillion, down 4.7% from the second quarter. This is the largest quarterly decline since the second quarter of 1962 when net worth of households dropped 5.0%.

“Household spending will suffer as setback a household net worth shrinks, which is already visible in consumer spending data, and the proclivity of households to borrow will show a reduction. The chart below indicates that growth of both mortgage and consumer debt have fallen in the third quarter. The sharp drop in mortgage debt (-2.4%) reflects the impact of mortgage foreclosures and a drop in home purchases, while consumer debt grew at a 1.2% pace in the third quarter versus a 7.2% jump a year ago.”

Source: Asha Bangalore, Northern Trust – Daily Global Commentary, December 11, 2008.
Asha Bangalore (Northern Trust): Weak trajectory for retail sales
“Retail sales fell 1.8% in November, after a 2.9% decline in the prior month. Retail sales have dropped for five straight months, the longest string of declines since record keeping for retail sales began in 1967. The wide swings of gasoline prices influence the headline of retail sales. Excluding gasoline, retail sales dropped 0.2% in November after a 1.6% plunge in the prior month. Retail sales excluding gasoline have recorded six consecutive monthly declines. Unit auto sales have fallen in ten out of eleven months of the year.
“The upshot is that with or without gasoline and autos, retail sales show an extraordinary weakness that is seen the overall consumer spending data and this weak trajectory for retail sales and overall consumer spending is predicted to prevail in the near term.”

Source: Asha Bangalore, Northern Trust – Daily Global Commentary, December 12, 2008.
Asha Bangalore (Northern Trust): Consumer spending in post-war recessions
“The chart below illustrates the history of consumer spending during recessions. Consumer spending typically declines in recessionary periods with the exception of the 1948 and 2001 recessions.
“Our forecast includes five consecutive quarterly declines in consumer spending, possibly another record for the books if our forecast is accurate. The highly leveraged household balance sheet of households underlies this prediction.”

Source: Asha Bangalore, Northern Trust – Daily Global Commentary, December 8, 2008.
Bloomberg: Inside look – housing crisis
“From Housing Forum in Washington D.C.: Interview with PIMCO Managing Director Scott Simon.”

Source: Bloomberg (via YouTube), December 8, 2008.
BusinessWeek: Unretired – retirees are back, looking for work
“They saved. They planned. Then housing tanked and the markets melted. Now they need jobs, and there aren’t any.

“Six years ago, Paul Nelson gave up his long career in the defense industry for what he thought would be a peaceful retirement in Tucson. The weather was mild, the neighbors friendly. He had plenty of time to volunteer and garden.
“But retirement hasn’t worked out the way he planned. In 2006 his wife of 46 years died unexpectedly. He tried to swap their house for a smaller one and lost a chunk of his retirement savings in the process. Then this year the stock market cratered, wiping out almost everything he had left. Now the 71-year-old is looking for work at local hardware stores and Home Depot and contemplating filing for personal bankruptcy. ‘I have nothing left,’ says Nelson, a former Raytheon engineer. ‘I am not alone, I think.’
“Far from it. An increasing number of people who retired in recent years, confident they had set aside enough to live on comfortably, are finding themselves strapped. The stock market plunge and the housing downturn have affected many Americans, of course. But retirees have been particularly pinched because their homes and investments are the primary assets they depend on for income. As a result, many of the country’s elderly are finding themselves in Nelson’s situation, low on money and looking for work. ‘Suddenly the rug has been pulled out from under them,’ says Alicia H. Munnell, director of the Center for Retirement Research at Boston College.”
Click here for the full article.
Source: Heather Green, Business Week, December 4, 2008.
Asha Bangalore (Northern Trust): Oil imports lead to wider trade gap in October
“The trade deficit widened to $57.2 billion in October from $56.6 billion in September. During October, exports (-2.2%) and imports (-1.3%) of goods and services fell.”

Source: Asha Bangalore, Northern Trust – Daily Global Commentary, December 11, 2008.
Reuters: Jim Rogers calls most big US banks “totally bankrupt”
“Jim Rogers, one of the world’s most prominent international investors, on Thursday called most of the largest US banks ‘totally bankrupt’, and said government efforts to fix the sector are wrongheaded.
“Speaking by teleconference at the Reuters Investment Outlook 2009 Summit, the co-founder with George Soros of the Quantum Fund, said the government’s $700 billion rescue package for the sector doesn’t address how banks manage their balance sheets, and instead rewards weaker lenders with new capital.
“Dozens of banks have won infusions from the Troubled Asset Relief Program created in early October, just after the September 15 bankruptcy filing by Lehman Brothers. Some of the funds are being used for acquisitions.
“‘Without giving specific names, most of the significant American banks, the larger banks, are bankrupt, totally bankrupt,’ said Rogers, who is now a private investor.
“‘What is outrageous economically and is outrageous morally is that normally in times like this, people who are competent and who saw it coming and who kept their powder dry go and take over the assets from the incompetent,’ he said. ‘What’s happening this time is that the government is taking the assets from the competent people and giving them to the incompetent people and saying, now you can compete with the competent people. It is horrible economics.’
“Rogers said he shorted shares of Fannie Mae and Freddie Mac before the government nationalized the mortgage financiers in September, a week before Lehman failed.
“Now a specialist in commodities, Rogers said he has used the recent rally in the US dollar as an opportunity to exit dollar-denominated assets.
“While not saying how long the US economic recession will last, he said conditions could ultimately mirror those of Japan in the 1990s. ‘The way things are going, we’re going to have a lost decade too, just like the 1970s,’ he said.
” … Rogers said sound US lenders remain. He said these could include banks that don’t make or hold subprime mortgages, or which have high ratios of deposits to equity, ‘all the classic old ratios that most banks in America forgot or started ignoring because they were too old-fashioned’.
“‘Governments are making mistakes,’ he said. ‘They’re saying to all the banks, you don’t have to tell us your situation. You can continue to use your balance sheet that is phony … All these guys are bankrupt, they’re still worrying about their bonuses, they’re still trying to pay their dividends, and the whole system is weakened.’
“Rogers said he is investing in growth areas in China and Taiwan, in such areas as water treatment and agriculture, and recently bought positions in energy and agriculture indexes.”
Source: Jonathan Stempel, Reuters, December 11, 2008.
CNBC: Meredith Whitney – outlook grim for banks

Source: CNBC, December 7, 2008.
Financial Times: Post-Lehman company defaults to soar
“Default rates for speculative grade companies are forecast to jump threefold next year following the fall of Lehman Brothers, the world’s biggest bankruptcy, according to Moody’s, the US ratings agency.
“The implosion of Lehman on September 15 is widely regarded as a significant milestone, turning the credit crunch into a fully blown economic crisis.
“Jim Reid, credit strategist at Deutsche Bank, said: ‘We are at a turning point for default rates, with much bigger monthly rises from now on.
“‘Two or three months after Lehman’s collapse, we are starting to see the impact on the real economy, particularly for those companies on short-term funding.’
“European companies defaulting on their bonds are also set to outpace those in the US, although analysts suggest this is because the European junk-grade market is smaller, meaning any rise in defaults has a greater impact in percentage terms, rather than pointing to a deeper recession.
“Global default rates are forecast to rise to 10.4% by November 2009 – from 3.1% last month – to levels last seen in 2001 following the dotcom crash. Rates are forecast to jump to 4.2% by the end of this year.
“A year ago, the global rate was 0.9 per cent.
“The ratings agency’s distressed index, which measures the number of companies with bonds trading at more than 1,000 basis points over government paper, rose to 51.8% at the end of last month, up from 48.5% at the end of October, and the highest level since Moody’s launched the index in 1996. This reflects the deepening problems for company funding. Even some investment grade companies are now trading at distressed levels.”
Source: David Oakley and Paul J Davies, Financial Times, December 8, 2008.
Bespoke: 10-Year Treasuries overbought
“It’s an understatement to say that Treasuries are overbought at current levels. We’ve been monitoring the spread between its price and its 50-day moving average, and the 10-year Note has finally gotten to a level that is usually met with selling pressure in the near term. Since 1977, the 10-year has only gotten more than 12% above its 50-day moving average on three different occasions. As shown in the table below, the returns over the next week, month, and 3 months lean to the negative side. The average change of the 10-year over the next three months when getting this overbought has been -3.23%.”


Source: Bespoke, December 9, 2008.
Bespoke: Want to lend money to uncle Sam? It’s going to cost you
“What would your reaction be if you had a friend who had reached the limit on 20 different credit cards and then came to you to borrow $100? Then imagine that you actually said yes, and when you went to give your friend the $100, he or she actually asked for $101 just for the privilege of loaning the money. Well, that is exactly what is happening (to a lesser degree) in the US T-bill market. As just another example of the crazy times we are living in, the yield on 3-month Treasuries went negative today. There was a time when an event such as this was unimaginable. Today it barely gets noticed.”

Source: Bespoke, December 9, 2008.
John Hussman (Hussman Funds): Unusually unfavourabale yield levels for Treasuries
“In bonds, the market climate last week was characterized by unusually unfavorable yield levels and generally favorable yield pressures. As I have frequently noted, yield levels are much more important than market action in driving subsequent total returns in bonds. This is because bonds are less susceptible to ‘bubbles’ as a result of their payment stream being known, so favorable market action can’t be taken as evidence of favorable surprises in those payments.
“The problem with Treasury yields here is that while there are good economic reasons for the downward yield pressures, the levels are low enough to invite explosive spikes that can easily wipe out a year or more of yield-to-maturity in a few days.
“Corporate yields have increased significantly, but default rates tend to pick up in the later stages of recessions, and there isn’t much historical evidence to suggest that corporate bonds reach their lows any earlier than stocks do. For that reason, corporate bonds are essentially equity-equivalents here, and the same considerations about quality apply as well here as they do for stocks. Generally speaking, corporate bonds are currently priced to deliver both lower long-term returns than stocks, but as a group, will probably have lower volatility than stocks as well.”
Source: John Hussman, Hussman Funds, December 8, 2008.
Bloomberg: US Treasury risk surpasses Campbell Soup as debt increases
“The cost to hedge against losses on US Treasuries surpassed the price of default protection on bonds from Campbell Soup and drug-maker Baxter International as government spending on stimulus packages grows.
“Credit-default swaps protecting US government debt in euros for five years are trading at 65 basis points, according to CMA Datavision, meaning costs 65,000 euros ($84,200) to protect 10 million euros of debt. Contracts on Campbell were at 52.5 basis points and Baxter contracts were 57.5 basis points at the close of trading [on Wednesday] in New York.
“The Federal Reserve’s assets have more than doubled from a year ago to $2.14 trillion as the central bank seeks to revive credit markets. Economists including Harvard University professor Kenneth Rogoff and Nobel Prize winner Joseph Stiglitz say President-elect Barack Obama should push for a stimulus package of at least $1 trillion to lift the economy out of a yearlong recession. The US government’s total cost to bail out the economy may exceed $4 trillion, according to strategists including Ira Jersey at Credit Suisse Group AG in New York.
“Contracts protecting U.K. government debt for five years were quoted at a mid-price of 114.75 basis points today [Wednesday], according to CMA. Swaps on Italy are at 190, and the Netherlands at 99.5. France was quoted at 58.75 and Germany at 51.5, CMA data show.
“Credit-default swaps pay the buyer face value in exchange for the underlying securities or the cash equivalent if a borrower fails to meet its debt obligations. A basis point on a credit-default swap contract protecting $10 million of debt from default for five years is equivalent to $1,000 a year.”
Source: Shannon D. Harrington, Bloomberg, December 10, 2008.
Jean-Paul Calamaro (Deutsche Bank): Credit markets offer stunning opportunities
“The crisis gripping financial markets has produced some stunning investment opportunities in credit markets. Among the best is the returns available on ‘basis trades’ between corporate bonds and credit default swaps, says Jean-Paul Calamaro, global head of quantitative credit strategy at Deutsche Bank.
“‘Investors buy a corporate bond and also buy default protection on the issuer via a CDS. When the basis is negative [CDS protection costs less than the bond’s spread to swaps] this produces protected cash flows and further profits if the difference between the bond and CDS narrows, or if the issuer defaults. The basis between bonds and CDS has been at historic wides recently, giving significant returns without using leverage,’ he says.
“‘The trade works for many investment grade and high yield issuers in Europe and the US, but high yield trades look most attractive.
“‘This is because investors can earn high returns more quickly when an issuer defaults and at this point in the credit cycle we think defaults are more likely. The trades also work in investment grade, not because we expect defaults but because we expect the basis between bonds and CDS to narrow.
“‘The major cheapening of bonds versus CDS across corporate credit has been due to the heightened funding crisis since the Lehman bankruptcy in mid-September. We believe conditions will start to ease after year end, which makes these types of trades unusually attractive now.'”
Source: Jean-Paul Calamaro, Deutsche Bank (via Financial Times), December , 2008.
Bloomberg: Cheapest stocks since 1995 show cash exceeds market
“Stocks have fallen so far that 2,267 companies around the globe are offering profits to investors for free. That’s eight times as many as at the end of the last bear market, when the shares rose 115% over the next year.
“Bank of New York Mellon in New York, Danieli in Italy and Seoul-based Namyang Dairy Products hold more cash than the value of their stock and debt as the slowing world economy wiped out $32 trillion in capitalization this year. Companies in the MSCI World Index trade for an average $1.17 per dollar of net assets, the lowest since at least 1995, and 39% sell at a discount to shareholder equity, data compiled by Bloomberg show.
“The cash-rich companies allow investors to pay nothing for future earnings streams, providing opportunities to buyers concerned about deflation, according to Jean-Marie Eveillard, whose $16 billion First Eagle Global Fund has beaten 98% of competitors this year. Microsoft and Novo Nordisk, which generate the most money compared with debt, can expand even if lower consumer demand erodes profits.
“‘Cash is king, not necessarily for the investor but for corporations,’ Eveillard said in an interview from New York last week. ‘It’s useful to sit on a ton of cash, No. 1 to survive, as opposed to going bankrupt, and No. 2 to seize opportunities either to make acquisitions cheaply or to squeeze competitors.'”
Source: Michael Tsang and Alexis Xydias, Bloomberg, December 8, 2008.
Richard Russell (Dow Theory Letters): “I’m beginning to like what I see”
“If they create enough of it, will they come and spend it? That’s what Mr. Bernanke is going to find out. The government has created over a trillion dollars of currency. There’s now over $8 trillion on the sidelines in money markets and T-bills – all frozen with fear and waiting for something better and safer to come along. There’s too much money now in relation to the quantity of goods and merchandise available. This is the formula for inflation or even hyper-inflation. What’s holding it all back? Lack of confidence, fear.
“What would change that? The stock market rising steadily would bring back confidence. Which is why I monitor the stock market so closely. Yes, it’s quite a game, and it’s the most important and fascinating game in the world. No wonder I’m in this business. I read the markets, and I’m beginning to like what I see!
“My guess is that the market is establishing a tradeable bottom with a rally that will last into the first quarter of next year. What we’re seeing now might not be the final bottom but it will serve until the real one comes along.”
Source: Richard Russell, Dow Theory Letters, December 8, 2008.
Richard Russell (Dow Theory Letters): Adding some selected stocks
“Up to now, our favored position has been cash and gold (preferably physical gold). Our new position is cash, gold and, for the bolder crowd, a few selected stocks (DIA if you’re a fearless, speculative type).
“Backing off: Subscribers may think Russell’s lost his mind. He’s turning just a bit bullish. The answer is that I’m reporting exactly what I’m seeing. And if what I see doesn’t jibe with what I’m reading in the newspaper and it doesn’t jibe with prevailing sentiment, then I think it’s that much more important. I keep hearing the most horrendous stories about unemployment and companies in trouble, and my thought is always, ‘Has this been discounted by one of the worst bear markets since the ’30s?’ Which is why I report every item that I see, every item that might suggest that the market has already discounted the bad news. The question always is ‘cut through the BS, what is the market saying?'”
Source: Richard Russell, Dow Theory Letters, December 11, 2008.
Puru Saxena: Sowing the seeds
“This nasty bear-market is in its latter stages and I suspect that the bulk of the declines are now behind us. Although it is premature to claim that the bear-market definitely ended on October 10, it does look increasingly likely that the lows recorded on November 21, were in fact a successful ‘test’ of the prior month’s lows.
“History shows that following a major bear-market, it is common for the major indices to retest the lows. In a recent study undertaken to review recovery patterns, JP Morgan examined all the bear-markets going back to 1900 and it came up with a few interesting observations. The study revealed that market bottoms were almost always retested and that such ‘tests’ resulted in a new marginal low about 40% of the time.
“The study also found that 75% of the retesting events occurred within 44 days of a major bottom; so if October 10 marked the bottom of this bear-market, the retest on November 21 was bang on target from a timing perspective.
“At this stage, I am only guessing that October 10 was the pivotal turnaround of this bear-market. It may well be that this market breaks below those lows in the days ahead, however given the favourable technical and sentiment data, at the very least, there is a strong possibility that we will get a multi-month rally from these oversold conditions.
“It is worth noting that new bull-markets are always born amidst abject pessimism; at a time when the majority are convinced that economic activity will never pick up again. Furthermore, it is interesting to note that frightening economic news continues to surface, long after a new bull-market has begun. So, the time to buy is during such scary times. This was also highlighted by Warren Buffet who recently wrote – ‘If you wait for robins, spring will be over’.
“Now, I cannot say with any certainty whether we are already in the early stages of the next cycle. However, the recent rout in the markets has set the stage for above-average long-term returns. Under my best case scenario, we are in the very early stages of a new multi-year bull-market. And under my worst case scenario, we are going to get a very strong rebound (30% move higher in the S&P500) over a short period of time, which will probably take the markets back to their 200-day moving averages.”
Source: Puru Saxena (via Fullermoney), December 10, 2008.
David Fuller (Fullermoney): S&P 500 at extreme divergence from its 200-day moving average
“We first posted this indicator on October 10 when the relevant spreadsheet was created for us by a subscriber. The indicator remains at a historically low level but has risen considerably from its early October nadir. This has been achieved by the relevant indices having gone mostly sideways for the last two months. The moving average is now starting to come down towards the price and while it still has a long way to go, mean reversion is taking place.
“This is not a guarantee that the market will not go lower later but, historically, when the market has diverged from its mean by such a margin, important stock market lows have occurred relatively soon afterwards.”

Source: David Fuller, Fullermoney, December 8, 2008.
Bespoke: Percentage of stocks above 50-day moving averages
“Even though the S&P 500 is in a new bull market, the percentage of stocks in the index trading above their 50-day moving averages is still at oversold levels. As shown in the chart below, at 26%, this indicator has a long way to go before becoming overbought.
“On a sector basis, Telecom, Utilities, and Consumer Discretionary have the highest percentage of stocks above their 50-days, while Energy and Financials have the lowest.”

Source: Bespoke, December 10, 2008.
Bespoke: Third worst bear market on record
“The S&P 500 finally had its first 20%+ rally in 408 days yesterday [Monday], which means we’re currently in a bull market by the standard definition (20% rally preceded by a 20% decline).
“… below we highlight historical bear markets for the S&P 500 since 1927. As shown, the bear market that ran from 10/9/07 to 11/20/08 is the third worst ever with a decline of 51.93%. The bears that ended in June of 1932 (-61.81%) and March of 1938 (-54.47%) are the only two that had bigger declines without a rally of 20%.”
Source: Bespoke, December 9, 2008.
Bespoke: US sector and stock buy ratings
“Below we highlight the average percentage of buy ratings for stocks in each of the ten S&P 500 sectors. As shown, Financial stocks have the lowest percentage of buy ratings of any sector at 35%, while Energy has the highest at 63%. Consumer Discretionary, Materials, and Consumer Staples are the three other sectors (along with Financials) that have below average buy ratings compared to all stocks in the S&P 500.

Source: Bespoke, December 8, 2008.
David Fuller (Fullermoney): Commodities – are they the most promising asset class today?
“I do think commodities have significant recovery potential, despite the global economic slump, deflation threat and depression fears. Moreover, I believe that the fundamentals for commodities have now improved more than for all other asset classes.
“Consider the following bull points:
1. Interest rates have fallen, which is currently better for commodity speculators than commodity producers, because contangos have shrunk considerably, lowering rollover costs.
2. However, the credit crunch means that it is now more difficult for commodity producers to obtain necessary financing. Consequently, miners and oil producers are deferring development projects and laying off workers, while farmers find it more difficult to finance the purchase of fertilizers and equipment. These problems are not fully offset by the lower cost of energy.
3. Prices for all commodities are much lower today than during the first half of 2008, not least because speculators have been shaken out and traders are actually short. This is good news for those who wish to buy oversold commodities. However it is a big disincentive for commodity producers, many of whom are now reducing production.
4. While the global economic slump has reduced demand for commodities somewhat, these are essential resources which the world cannot do without, unlike luxury goods, the latest fashions, lavish holidays or expensive restaurants.
5. The US dollar has peaked and commenced what is likely to be a significant retracement of gains seen since July. This is bullish for commodities because most are priced in US dollars.
“What could significantly delay or even prevent a big rally for commodities? The reflationary efforts could fail, or more likely take many more months before they turn a global economy that is still contracting. If so, there could be some additional downside risk and base formation development would most likely be lengthy. The US Dollar Index could fail to maintain its downward break. Improved weather patterns could lead to increased supplies of agricultural commodities.
“For these reasons, Fullermoney maintains that commodities are best purchased following setbacks. Positions are most safely built incrementally.”
Source: David Fuller, Fullermoney, December 11, 2008.
Financial Times: So long, super-cycle
“The severity of the crisis has surprised natural resources companies’ executives, commodity traders and Wall Street bankers alike. After all, the commodities boom of 2003-08 has been the most notable for a century in its magnitude, duration and the number of commodities whose prices it has lifted. The sudden plunge poses a fundamental question: is this just a temporary blip within an upward trend, with prices likely to rebound in the medium term, or is it the conclusion of another commodities cycle of boom and bust, with a period of relatively stable prices coming ahead?
“The common belief in the industry itself, and among most Wall Street analysts, is that the market is undergoing a correction but that the boom years have not ended. As many point out, the main drivers of what many have come to see as a commodities super-cycle – such as strong pent-up demand in emerging countries and supply constraints caused by a lack of investment over the past 20 years, along with the rise in resource nationalism – are intact. The current drop is, in the words of one senior mining executive, a ‘reset’ of the boom, not the end of it. Prices will rebound, in this view, and continue rising.”
Click here for the full article.
Source: Javier Blas and Krishna Guha, Financial Times, December 9, 2008.
Bespoke: Consensus gold estimates
“Below we provide the consensus price target for gold through 2012. These target prices are based on the median of 21 gold analysts surveyed by Bloomberg. As shown, analysts currently aren’t expecting a big rally or a big decline in gold over the next few years. By mid-year 2009, analysts are expecting gold to be at $825/ounce, which is less than $10 from its current price of $816. At the end of 2011, analysts expect gold to be down to $790, and then down to $762 by the end of 2012.”

Source: Bespoke, December 12, 2008.
Casey’s Charts: Gold stocks – time to bottom feed
“The previous low point for the ratio of the XAU gold stock index to the price of gold was 0.16, when gold was trading around $270 an ounce in October of 2000. Today, the XAU is trading a mere 57% higher than it was in October of 2000, compared to a gold price that has increased by 184%. As a general rule of thumb, anytime the ratio is above the 25-year average is the time to sell, and below its average says gold stocks are cheap. With the ratio bouncing off the lowest level since the inception of the XAU index, it signals a SCREAMING buy for gold stocks!

“Picking the bottom of any market is near impossible, but knowing when something is grossly undervalued can be easy. Gold has long been considered a hedge against inflation, and with trillions of new government bailout dollars ready to circulate into the system, buying precious metal stocks at these distressed prices is the chance of a lifetime.”
Source: Casey’s Charts, December 5, 2008.
Profit NDTV: Asia beats US in gold futures trading
“Asia, which accounts for 60% of the world gold imports, has overtaken the US in gold futures trading, with Mumbai and Shanghai exchanges growing rapidly, leading trade magazine Futures Industry has reported.
“According to the latest edition of the US-based magazine, data from the first eight months of this year show that the combined volumes in gold futures trading at exchanges in Shanghai, Tokyo, Taiwan and Mumbai reached 49.8 million contracts, far ahead of the 34.3 million contracts traded in the US.
“‘From January through August this year, seven of the top 10 gold contracts in the world were Asian,’ it said, adding that much of that growth was in Mumbai and Shanghai.
“‘Some of the boom is undoubtedly driven by the search for a safe haven as the value of stock investments continues to evaporate,’ the magazine said noting that Asian investors may also have a greater cultural predisposition toward gold than Westerners.
“Asia imports 60% of the world’s gold and its exports 40%. India is the largest consumer of physical gold in the world, followed by the US, and then China. And this year, China became the world’s largest gold producer – a title south Africa had held for more than 100 years.”
Source: Profit NDTV, December 9, 2008.
BBC News: UK economic slowdown “worsening”
“The UK economy contracted 1% between September and November, the National Institute of Economic and Social Research (NIESR) has estimated.
“This fall followed after a 0.8% drop in the three months to the end of October, said the think tank. Indicating that the rate of output decline is ‘accelerating’, the NIESR now expects a fall of more than 1% in the last three months of the year.
“Official data showed that the economy shrank 0.5% from July to September. But it will not be until January that the Office for National Statistics reports on the final quarter’s GDP.
“If it reports a decline for the three months to December, then the UK will be in officially in recession under the generally accepted definition of two consecutive quarters of decline.
“The NIESR says it has a good track record in forecasting GDP growth in advance of the official figures. The latest data from NIESR is just the latest indication that the UK economy is most probably falling into a recession.”
Source: BBC News, December 10, 2008.
Victoria Marklew (Northern Trust): Swiss rates head toward zero
“The Swiss National Bank (SNB) effectively lopped another 50bps off its main policy rate today, lowering its target band for three-month Swiss franc LIBOR to 0.0-1.0% (down from 0.5-1.5%) and aiming for the mid-point of 0.5%. This brings the easing total to 225bps since October 8.
“The SNB warned that the sharply worsening global climate will push Switzerland into recession next year. Chairman Roth stated that growth is likely to be negative, not just in the first two quarters of 2009 but for the year as a whole. The bank is now forecasting a contraction in real GDP of between 0.5% and 1.0% next year. The inflation forecast was also revised down, with the bank now seeing the annual rate averaging 0.9% next year and 0.5% in 2010.”
Source: Victoria Marklew, Northern Trust – Daily Global Commentary, December 11, 2008.
Financial Times: Japan contracts faster than expected
“Japan’s gross domestic product contracted much more rapidly in the third quarter than previously thought, official data showed on Tuesday, amid new indications of distress in the world’s second-biggest economy.
“The revised GDP data showed a quarter-on-quarter fall of 0.5% for the three months to September, compared with last month’s preliminary estimate of a 0.1% decline.
“The economy contracted at an annualised rate of 1.8% between July and September – a much more precipitous pace than the annualised 0.5% decline suffered in the same quarter by the US, centre of the global financial crisis.
“Analysts said the revision, though bigger than expected, reflected relatively technical factors involving inventories and government spending rather than worrying new information and so would not dramatically change assessments of the economy’s prospects.
“‘The downgrade in headline growth does not look as bad as the headline suggests,’ UBS said in a research note.
“However, the news the recession was deeper than thought came as the Cabinet Office said its latest composite index of business conditions showed the economy ‘worsening’.”
Source: Mure Dickie, Financial Times, December 9, 2008.
Financial Times: China’s export fall worse than predicted
“The impact of the global financial crisis on China became clear on Wednesday when the government revealed that exports fell in November for the first time in almost seven years.
“With demand in many of its main markets slowing sharply, Chinese exports declined 2.2% from a year earlier. Imports also fell 17.9% from a year earlier, according to Chinese customs figures, prompting the government to announce plans to further boost the economy.
“The Chinese data shocked economists. The figures were far below forecasts, even in the light of sharp slumps in exports in November from both Taiwan and South Korea.
“‘This is the worst collapse in Chinese exports since 1999 and is probably just the beginning of a prolonged export contraction,’ said Isaac Meng, economist at BNP Paribas.
“The drop in imports, the biggest since the early 1990s, helped push the monthly trade surplus to a record $40 billion, the fourth month in a row that the surplus has broken records.
“The government pledged on Wednesday to do everything it could to maintain ‘stable, healthy’ growth next year. At the conclusion of the three-day Central Economic Work Conference, an annual meeting of top policy-makers, officials said they would boost public spending in order to promote domestic demand.
“A report on state radio about the meeting said the government had reaffirmed its policy of keeping the exchange rate ‘basically steady’, but would take other measures to deal with falling domestic demand.
“Until last month, China’s exports had held up much better than most observers had expected, increasing by 19% in October compared to the same month last year.”
Source: Geoff Dyer and Jamil Anderlini, Financial Times, December 10, 2008.
Financial Times: China inflation falls as growth slows
“China’s consumer price inflation fell to a 22-month low of 2.4% in November, giving the central bank free rein to cut interest rates further to offset an abrupt slump in the world’s fourth-largest economy.
“Economists had expected inflation to moderate to 3.0% from 4.0
% in the year to October. In the event, the reading was the lowest since January 2007.
“Nie Wen, an analyst with Huabao Trust in Shanghai, said the plunge meant real, inflation-adjusted interest rates in China were now back in positive territory even though the economy had run into fierce headwinds.
“‘The government will become more decisive in cutting rates,’ Nie said.
“Jing Ulrich, head of China equities at J.P. Morgan agreed. ‘We believe there is further scope for the central bank to ease monetary policy in an effort to avoid an excessive slowdown and stave off deflation,’ she said in a note to clients.
“‘Definitely we are going to move into a deflationary environment in China, probably through the first six months of the year,’ said Glenn Maguire, chief Asia-Pacific economist for Societe Generale in Hong Kong.”
Source: Financial Times, December 11, 2008.
Bespoke: Deflation coming in China?
“It wasn’t too long ago that one of the biggest worries facing the global economy was that improved standards of living in China would lead to higher wages for its workers. This, it was feared, would cause the country to begin exporting inflation around the world. As recently as August, PPI data from China showed that inflation was running at a rate of 10.1% year over year (y/y). Since then, however, pricing power in China has collapsed as evidenced by last night’s [Tuesday] release of the November PPI, which showed that prices are now up by just 2.0% y/y. At this rate, it won’t be long before we start seeing minus signs.”

Source: Bespoke, December 10, 2008.
Financial Times: Rouble exodus hits Russia’s credit rating
“Russia on Monday became the first G8 country since the start of the financial crisis to have its credit rating downgraded after Standard and Poor’s took fright at the recent exodus from the rouble and sharp drop in oil prices.
“S&P said it had lowered Russia’s foreign currency credit rating by one notch from BBB+ to BBB because of the ‘rapid depletion’ of the country’s foreign exchange reserves and the ‘difficulty of meeting the country’s external financing needs’. It said the outlook for the rating was negative.
“Russia’s reserves have fallen by $128 billion since August to $455 billion, as the country battles the capital flight that began following the war with Georgia and escalated as the oil price fell and the global crisis worsened.
“S&P said Russia could be forced to spend all $200 billion now parked in its two sovereign wealth funds on recapitalising the banking system and covering fiscal deficits in 2009 and 2010.
“The agency expects Russia to run a current account deficit next year of 2.6% of gross domestic product due to the oil price fall, putting further pressure on the balance of payments.
“‘There are a lot of layers of concern,’ said Frank Gill, primary credit analyst at Standard and Poor’s. ‘There are macroeconomic and political risks … and Russia has not operated a current account deficit since 1997 and that was less than 1% of GDP.’
“The thought of devaluation raises the spectre of the 1998 rouble crash that wiped out Russians’ savings, although economists say any devaluation this time would be far less severe.”
Source: Catherine Belton, Financial Times, December 8, 2008.

What's been said:
Discussions found on the web: