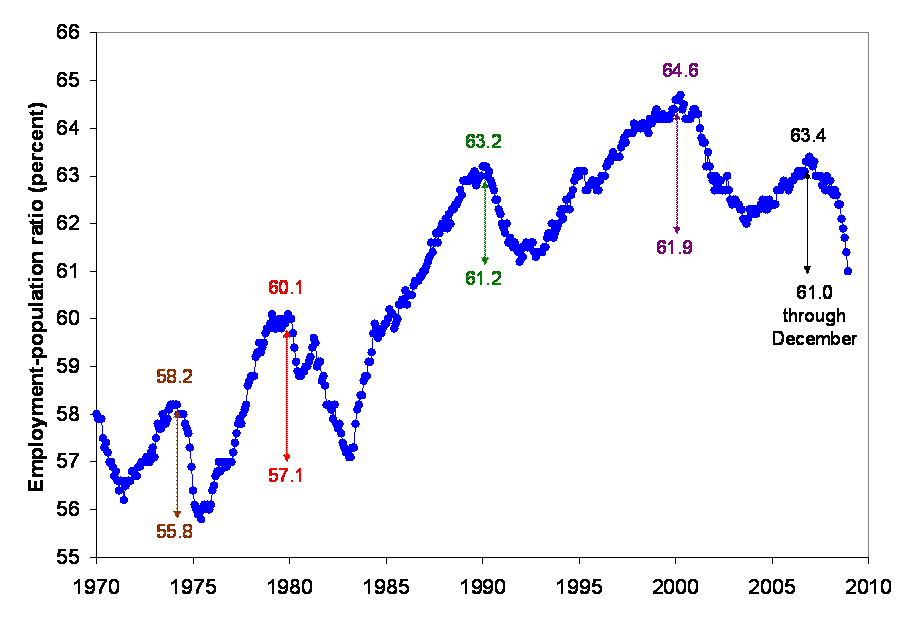
While looking at the unemployment numbers is useful, an additional employment metric that is very interesting over time is the labor force participation rate, since the fudging of “actively looking for work” is not involved. This series trended up because of the increase of women in the workforce through 2001, but is now back down to levels seen in the late 1980s! We’re 3.6% below the level seen in the dotcom boom, which translates to about 8.5 million less people employed. Moreover, the velocity of labor force participation decline in the last six months is particularly striking and does not look like it is approaching bottom.
Labor Force Participation Rate
chart by Mike McCarthy
The numbers on the chart are straight from BLS. The 8.5 million number is a personal calculation though. I pulled the civilian noninstitutional population of 235 million from Table C at BLS. Multiplying 235 million by (64.6 – 61.0) = 8.5 million less jobs than the equivalent 2000 participation rate.


What's been said:
Discussions found on the web: