BLS:
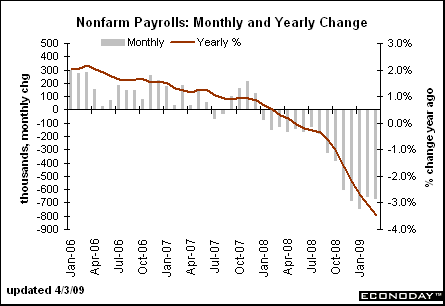
Nonfarm payroll employment continued to decline sharply in March (-663,000), and the unemployment rate rose from 8.1 to 8.5 percent, the Bureau of Labor Statistics of the U.S. Department of Labor reported today. Since the recession
began in December 2007, 5.1 million jobs have been lost, with almost two-thirds (3.3 million) of the decrease occurring in the last 5 months. In March, job losses were large and widespread across the major industry sectors.Unemployment (Household Survey Data) In March, the number of unemployed persons increased by 694,000 to 13.2 million, and the unemployment rate rose to 8.5 percent. Over the past 12 months, the number of unemployed persons has grown by about 5.3 million, and the unemployment rate has risen by 3.4 percentage points. Half of the increase in both the number of unemployed and the unemployment rate occurred in the last 4 months.
Ouch.
That is, as expected, an ugly number. Let’s look under the hood to see exactly how nasty it was:
• The decline in January was was revised to minus 741k. It was the largest peacetime fall in Employment in raw numbers; Only the post WWII declines were larger — 834,000 1949, and an astounding loss of ~two million jobs in 1945 — were, according to the WSJ, one-time events, including a large coal and steel strike and by the end of World War II.
• However, the 1949 data was when the the population was much smaller. Let’s put this into a broader context in percentage terms. Marketwatch’s Rex Nutting notes that over “the past six months, 3.7 million jobs have been lost, or 2.7%, the second-largest percentage loss in 50 years.” Yes, its been that ugly.
• The Birth/Death adjustment, everyone’s least favorite statistical adjustment, suggested that birth/death model the economy added an implausible 114k new jobs;
• U6 Total Unemployed, the broadest measure of labor underutilization, ticked up to 15.6% (16.2% NSA);
• Downward revision to the prior two months were -86k;
• Every major category except education and health shed jobs.
Earlier this morning, I noted that although NFP lags the economic cycle, there are components of the Employment data that lead the economy. Let’s take a quick look at these elements:
• Total hours worked fell by 1%. Often times, employers who are trying to hold onto their best employees will cut overtime and hours in order to avoid layoffs. As of this month, the average workweek fell to 33.2 hours, the lowest on record dating back to 1964.
• Temporary help services lost 72k workers. This suggests that the bottom of the recession is not yet in, and that further contractioin is likely.
• Average hourly earnings rose 0.2% m/m. That is in line with the prior trend. Average weekly earnings dipped 0.14%, likely following the slight loss in total hours worked.
>
March 2009 NonFarm Payrolls
chart courtesy of Barron’s Econoday
>
Sources:
Employment Situation
http://www.bls.gov/news.release/empsit.toc.htm
Job losses breach 5 million mark
Rex Nutting
MarketWatch, April 3, 2009
http://tinyurl.com/cmgfze
Recession Jobs Losses Top 5 Million
BRIAN BLACKSTONE
WSJ, April 3, 2009
http://online.wsj.com/article/SB123876121625986405.html


What's been said:
Discussions found on the web: