Kevin Lane is one of the founding partners of Fusion Analytics, and is the firm’s director of Quantitative Research. He is the main architect for developing their proprietary stock selection models and trading algorithms. Prior to joining Fusion Analytics, Mr. Lane enjoyed success as the Chief Market Strategist for several sell side institutional brokerage firms. In those capacities he oversaw the firms’ research departments. He produced a broad range of widely followed institutional research publications ranging from industry specific notes to quantitative/fundamental reports on individual stocks. His buy side clientele consisted of many of the nations top money managers and hedge fund managers. Mr. Lane is a member of the Market Technicians Association.
~~~
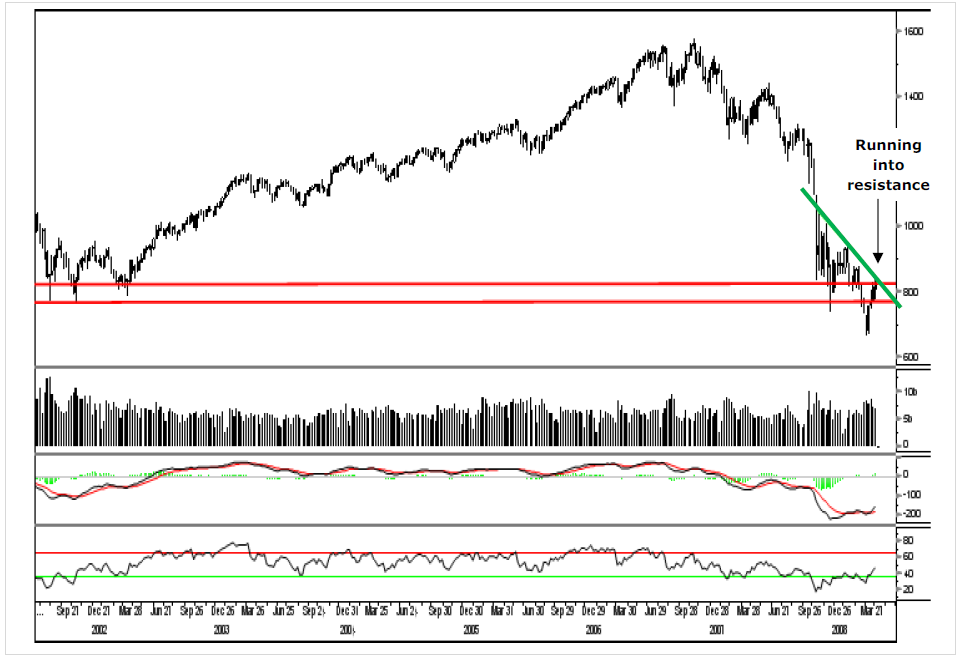
S&P 500 – Weekly Chart (rolling prices through 04/03/09)
>
The S&P 500 is rallying back into its’ upper resistance zone and minor downtrend line … The market has now moved 26.37 % off the intraday low set on March 6th 2009. The easy call here is to say, “ Sell everything and lock in the gains from this trading rally and wait for a re-test then buy back in ! ” However as we all know the easy calls are the ones that are so obvious they never seem to work out. As the old traders saying goes, “ The market is here to reward the minority and confound the majority. ” After meeting a lot of investors recently in meetings many feel and I quote “ Safe ” in cash and also “ Do not mind having missed this move.” So anecdotal sentiment observations are this rally is not real. When I hear that from a lot of people it makes me think resistance or not we may have a shot to work higher still. That said let’s look at the charts.
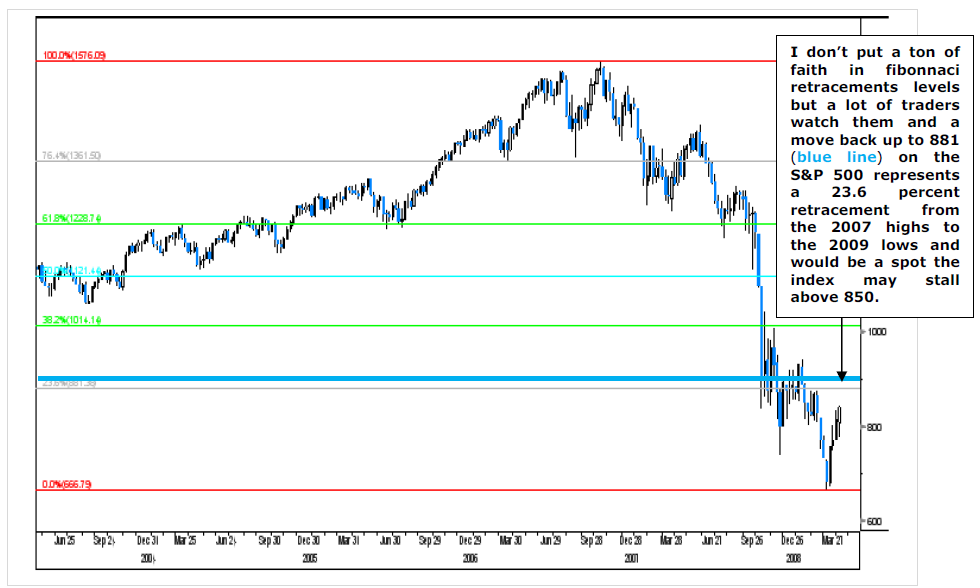
As seen above the S&P 500 is at its’ minor downtrend line (green line) as well as its’ upper resistance level (upper red line) near 850. Support and resistance, while not an exact science, do provide us back drops as to where markets are likely to stall or bounce. However when looking at support and resistance one must gauge what buying (and selling) power look like to give them an idea of whether those support(s) or resistance areas are likely to hold. Right now liquidity is strong as evidenced several times of late by the market dipping and roaring back. So while the market could stall here near 850, if liquidity is strong it could pop up to 881 (see chart below) the first Fibonacci retracement level from the 2007 highs to 2009 lows.
From a trading perspective the best way to play this market, (especially for those investors who bought aggressively a few weeks back when we suggested based on bullish internals the market could run aggressively) is to place tight trailing stops (such as a penetration of the 5 or 10 day simple moving average) on your positions and letting the stocks weakness take you out at a profit rather than trying to sell at the exact right market resistance level. An alternative could be selling ½ of your profitable holdings @ 850 (with trailing stops on the balance). A final alternative could be selling everything if the market gets to 880 (or if it gets above 850 but fails to stay there and then trades back below 850). If you make strategic sales there will be a chance to buy stocks again, the question is will it be lower or higher than here ? The jury is still out. The question one has to ask is will I feel worse if I sell nothing and the market pulls back or would I feel worse if I make some profitable sales and the market goes higher after I sell. Depending on how you answer those questions will go a long way as to determining your strategy.
>
S&P 500 Weekly Chart with Fibonacci Levels
~~~
Contact us for more information Trading/Institutional Contact
Please adjust the spam proof email address before sending !


What's been said:
Discussions found on the web: