Yet another case of anecdote trumping evidence: I am more than willing to entertain the possibility that squatters are a key component of this economic rebound, if only someone can show me some data that supports it.
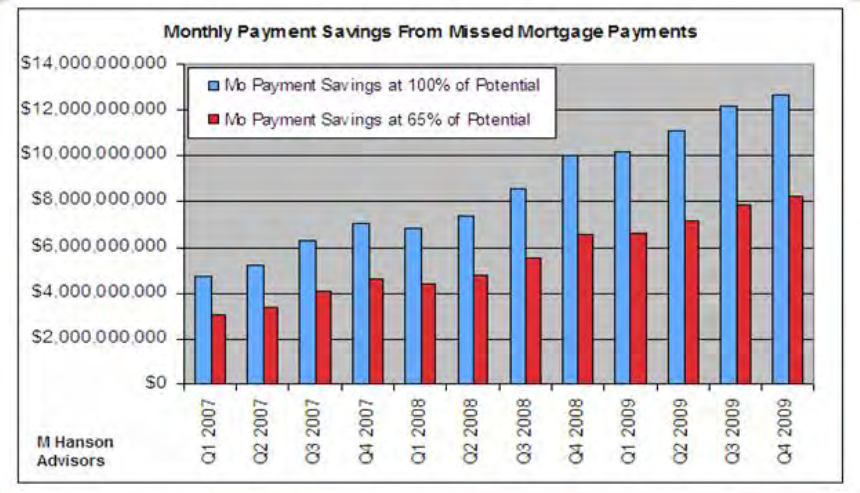
However, charts like the following, that calculate liabilities owed, are only half the equation:
>
7+ Million Homeowners in Default = $8-$12 Billion Per Month, or $100-$150 Billion Annually
Source: T2 Partners>
The above chart, from T2 Partners, shows the liability of defaulted homeowners. This is not a measure of cash, or savings, or spending — it only shows the total amounts owed.
Hence, this is a chart of liabilities, and not, as some authors have suggested, of savings and spending.
Would someone please demonstrate what the personal balance sheets of these 5-7 million delinquent people are, we can determine if squatters are driving retail sales. You need to show income earned, cash that is owed — but not paid — rather than the mere chart unfunded obligations.
How many of these squatters are amongst the 15 million unemployed ( ZERO Income) and the 6 million underemployed? My guess is most.
The squatting order that I deduce from the historical timeline and employment, income and default data is as follows:
Unemployment (or reduction of hours)
Reduction in Income
Late Payments
Missed Payments
Delinquency
DefaultSquatting !
(eventually) Foreclosure
The Urban Legend — as of yet unsupported by data:
Unemployment (or reduction of hours)
Reduction in Income
Late Payments
Missed Payments
Delinquency/Default
SquattingNon-Payment = Extra Income
Shopping!
If anyone thinks they can prove otherwise, by all means, please reveal your data . . .


What's been said:
Discussions found on the web: