
We looked at the Dow Rally, Duration and Magnitude over the weekend.
I would have like to see that data sliced into secular bull and bear markets, and after I mentioned this to Ron Griess of The Chart Store, he asked for my dates for those secular markets. I ballparked them as follows:
Bull: 1982-2000
Bear: 1966-82
Bull: 1941-1966
Bear: 1929-40
Bull: 1920-28
Bear: 1901-1920
You can play with breaking up the 1929-40 Bear as follows:
Bear: 1937-40
Bull: 1933-36
Bear: 1929-32
…but then you send up with shorter cyclical rallies, rather than full secular markets.
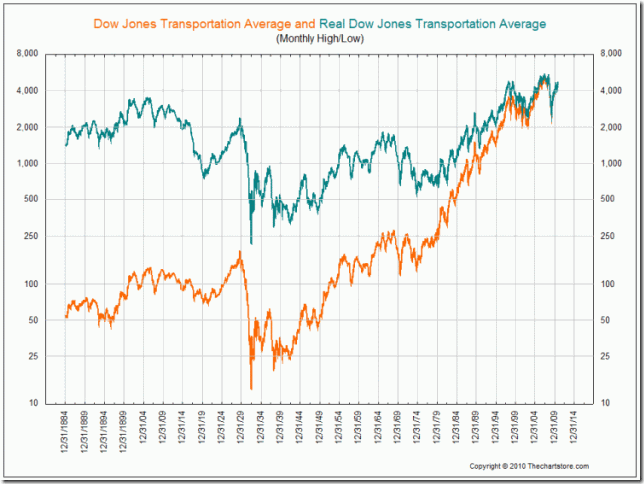
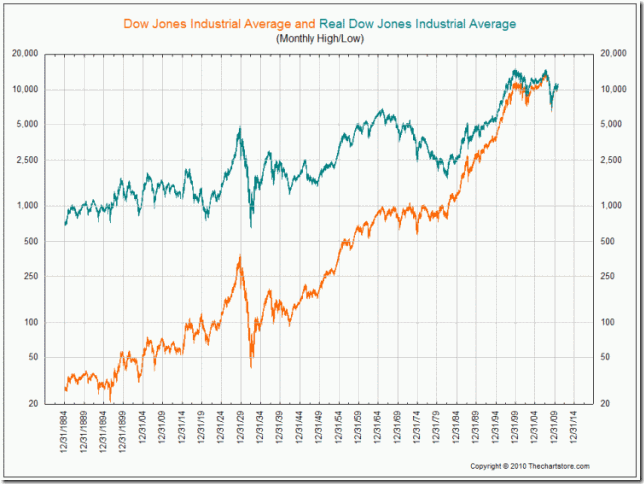
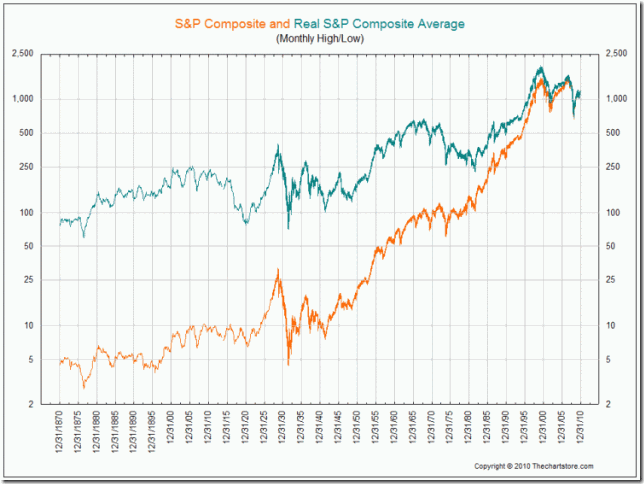
Ron Griess noted that it wasn’t just the cycle, but which index to use impacted the outcomes. And, he added, “I have found the cycles reveal themselves much clearer on inflation adjusted charts.”
Here are the charts of three of the longest series to consider. Ron notes “Look how much different the REAL DJT is when compared to either the DJI or S&P from 1906 to 1932.”
>
Real vs Nominal Gains: Dow Transports, Industrials, S&P500


What's been said:
Discussions found on the web: