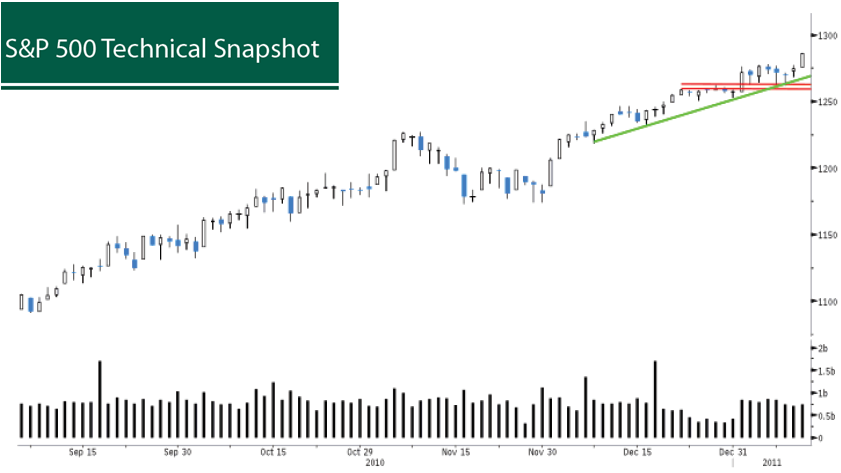
chart courtesy of FusionIQ
>
As seen in the above chart the trend (green line) remains up for the S&P 500 with minor support in the 1,263 to 1,260 area (red lines). With the trend still up and no penetrations of support one needs to respect the trend. Today we will get another look at AAII Sentiment Data, which has been elevated.
Sentiment is the overriding market concern and while measured sentiment data is a concern it appears that anecdotally there is more fear of a correction than bullish consensus. Our theory that a melt up may occur from a combination of sideline individual investor flows into equities and a re-allocation trade out of bonds and into stocks seems to be occurring. The trick will be knowing when to get off the carousel.


What's been said:
Discussions found on the web: