>
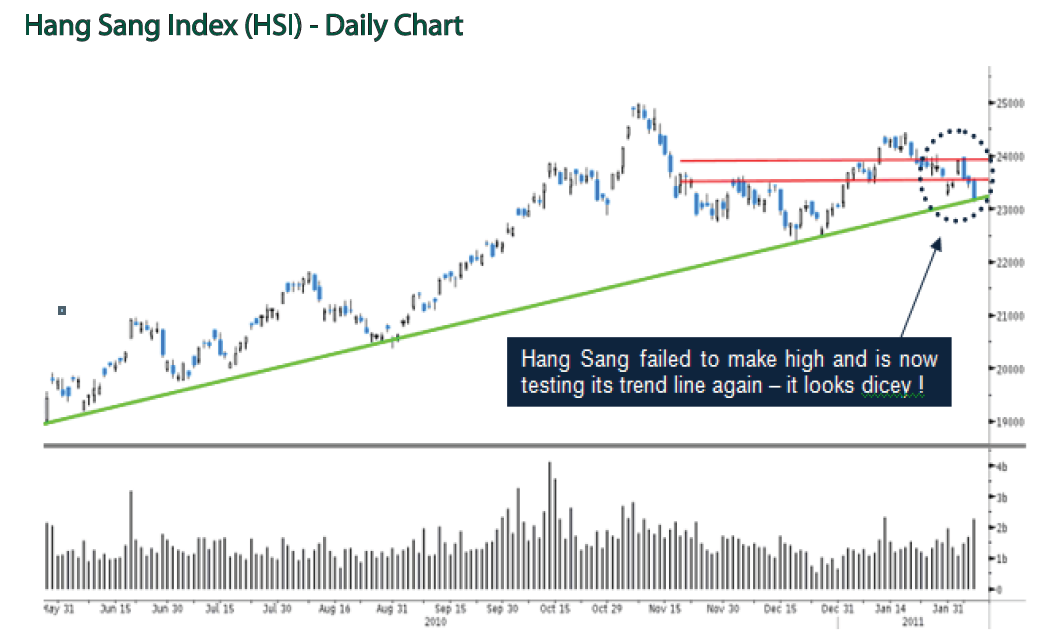
As seen in the chart above the Hang Sang Index failed to make new highs on its recent rally attempt last week by stalling at resistance (upper red line). The index has subsequently rolled over in the last few days and is now testing its uptrend line again (green line). China led the S&P 500 lower by correcting two weeks ahead on the S&P 500 during the S&P 500’s approximate 17.00 % peak to trough May to July 2010 correction, thus the Hang Sang about to break trend needs to be monitored closely as a leading indicator to price weakness here in the states.


What's been said:
Discussions found on the web: