 Macro Factors and their impact on Monetary Policy,
the Economy, and Financial Markets
MacroTides.newsletter@gmail.com
Investment letter – February 15, 2012
;
;
In the Garden of Europe
Monetary policy is a bit like watering a garden. Its nourishment is intended to foster growth and jobs, and when in full bloom, a rising standard of living for the majority of people in society. A functioning spigot (central bank) and nozzle at the end of the hose (banking system) are needed for monetary policy to water the economic garden. If either isn’t functioning properly, too much or too little water will flow from the financial system into the economy. Just as too much water can kill a healthy plant, too much money can cause inflation, erode the purchasing power of workers, and lower their standard of living. When too little money (credit) flows, economies contract, unemployment rises, and government tax revenue falls.
In the last 35 years we have witnessed several examples when too much money was pushed into the U.S. economy by the Federal Reserve or aggressive bank lending. In the late 1970’s, inflation soared as commodity prices rose and higher wages became structural with cost of living adjustments (COLAs) increasing the cost of goods. This was brought to an end when the Federal Reserve increased the Federal funds rate to over 20%. Since inflation was running at 10%-12%, a 20% Federal funds rate represented a ‘real’ after inflation rate of 8%-10%, versus a historical real average rate of 2%. The excessively high ‘real’ rate caused a deep recession in 1981-1982 and a sharp drop in inflation. In the 1990’s, the cost of living remained stable, but stocks inflated excessively on the back of technological innovation and too much monetary accommodation, extenuated by Y2K. This ended when excess liquidity was drained from the financial system after Y2K, and the weight of absurd valuations caused technology stocks to crash 60%-80%. The monetary policy response to the deflating dot.com bubble, led to the housing bubble. However, just as the 1990’s stock market inflation was aided by the New Paradigm mentality of the technology boom, the housing bubble was also aided by factors outside of Federal Reserve monetary policy. The drift in lending standards that ended in no-doc liar loans. Rating agency prostitution that resulted in assembly line junk all rated AAA but generated billions in fees for the rating agencies. While all the shenanigans were operating in the open for all to see, there were those who touted a ‘hands off market knows best’ regulatory response, so abuses were allowed to continue. Another political group pushed to relax lending standards so lower income families could buy a home many couldn’t afford. The SEC earned their stripes by allowing banks to increase their operating leverage in 2004 from 12 to 1, to 30 to 1, giving banks enough time to load their balance sheets with AAA rated junk.
The excessive monetary accommodation that spurred the 1970’s inflation and the 1990’s inflation of technology stocks and stocks in general, did not impact the banking system. Other than banks located in regions dominated by oil exposure, i.e. Texas, most banks were able to insulate themselves from the 1970’s inflation. Since banks did not hold technology stocks on their balance sheets, they were only marginally affected by the dot.com bust, since the 2001 recession was short and shallow. It is important to note that the 1970’s inflation and boom in stocks during the 1990’s was global in nature, and not just limited to the United States. The housing bubble was also global in nature. The worldwide housing and commercial real estate bust has doubly impacted banks since they do hold residential and commercial mortgages on their balance sheets. In Europe, many banks held AAA mortgage pools leveraged 40 to 1, versus 30 to 1 in the U.S. Since 2010, European banks have also been negatively impacted by large holdings of sovereign debt from Greece, Spain, Portugal, and Italy.
 In response to the credit crisis in 2008, the Federal Reserve slashed interest rates to near 0% and aggressively expanded its balance sheet from $900 billion to $2.2 trillion. The Fed accomplished this by initially swapping their Treasury holdings for bank holdings of mortgages, auto loans, and credit card debt in April 2008. Although the Federal Reserve effectively opened the monetary spigot, the increase in bank reserves did not work its way into the economy. In early 2007, banks began tightening their lending standards, and continued to increase them throughout 2008 after the economy went into recession in January 2008. Despite extraordinary monetary accommodation by the Federal Reserve, the flow of credit availability into the U.S. economy remained constrained because the banking system nozzle remained virtually shut. Lending standards by U.S. banks remained tight throughout 2009 and didn’t begin to loosen until early 2010. This contributed to the weak recovery and is one of the reasons a self sustaining recovery has not been able to take hold in the U.S.
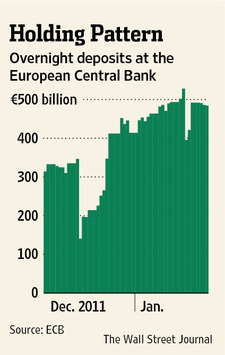
The European Central Bank has grudgingly and belatedly been forced to learn from our policy mistakes and the Federal Reserve’s experience. In early December 2011, the ECB launched the Long Term Refinancing Operation which allowed 524 banks to borrow $640 billion for 3 years at 1%. The ECB was forced to take this action to prevent a Lehman Brothers moment and a collapse of the European banking system, which would have threatened the global financial system. Policy makers learned that allowing Lehman Brothers to fail was a mistake that could not be repeated. In this regard, the LTRO has been a success, and has bought time. The ECB was hoping that the LTRO would increase lending by European banks. To date, most of the money the ECB lent to banks, in exchange for underwater sovereign debt holdings and commercial and consumer loans, has been deposited overnight with the ECB, rather than in new lending to businesses and consumers. (Chart pg.2)
We sense, however, that many strategists have extrapolated the success of the LTRO in preventing a full blown credit crunch, as also providing a solution for Europe’s recession and sovereign debt crisis. Averting a financial meltdown so a global depression didn’t develop is a good thing. But unless the availability of credit improves significantly, Europe’s recession has the potential of lasting longer than currently expected. A lingering European recession, or extended period of very slow growth, will worsen the fiscal conditions of the ailing countries in the European Union and keep the sovereign debt crisis alive and a threat into 2013.
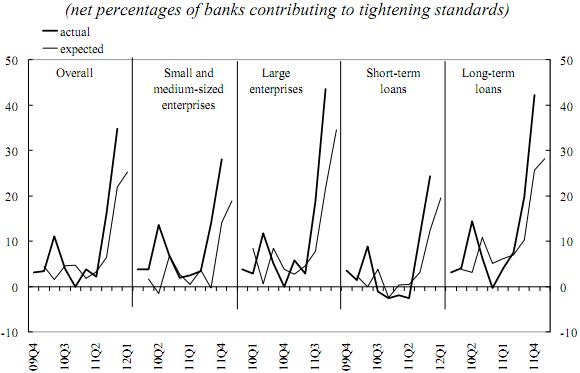
 It usually takes about six to nine months for a tightening in monetary policy to affect a slowing in an economy. This is true whether the tightening is done by the Central Bank, or by banks increasing their lending standards. In the third quarter 2011 lending survey by the ECB, 16% of banks increased their lending standards. In the fourth quarter, 35% of the banks surveyed said they had increased standards, more than double the 16% that had in the third quarter. (top Chart) The ECB also found that lending to the private sector grew at an annual rate of 1% in December, a sharp deceleration from 1.7% in November, and 2.7% in October. A breakdown of lending data showed that loans to the corporate sector plunged $48.6 billion in December, the largest one month decline ever. Loans to households shrank by $13 billion, and net mortgage lending fell by $9 billion. As we have noted previously, U.S. banks generate 35% of credit in the U.S The European banking system provides 80% of credit in the European Union, so credit availability from banks is vitally important. In addition, the broadest measure of money supply, M3, slowed to 1.6% in December from 2% in November, which is further evidence of less money flowing into the European economy. Given the normal lag time of six to nine months, the contraction in credit during the fourth quarter suggests that the slowdown in Europe could intensify in coming months and persist at least into mid-year.
In the Federal Reserve’s fourth quarter lending survey, U.S. banks were asked about their European lending. Although 42% said they hadn’t changed their standards, 38.5% said they had tightened them somewhat, and 19.2% said they had raised them considerably. The Fed also found that European banks had cut back their lending in the U.S. as well.
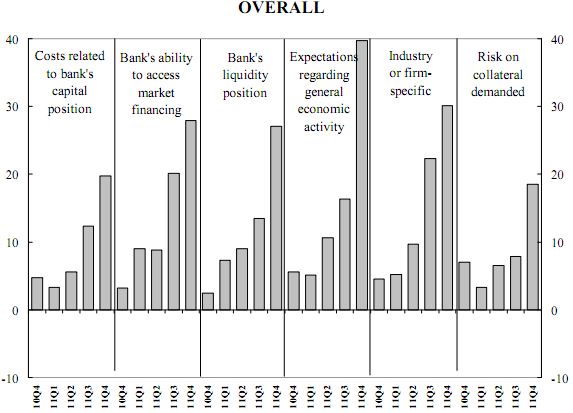
The ECB’s survey also asked why banks had tightened credit and found that 40% of the banks that had tightened credit standards had done so because of the slowdown in the economy. (Overall Chart pg.3) We suspect even more banks will decide to tighten as the effects of the European recession become more widespread. If current tighter standards are maintained, which is highly likely, growth could remain weak past mid-year. And, if more banks respond to the recession by tightening further in the first and second quarters of 2012, Europe’s recession will certainly last longer and probably be more severe.
The shrinking availability of credit will have a progressively negative impact on small and medium size businesses that do not have access to capital markets. When a company’s debt exceeds its assets and cash flow, it is considered insolvent. Corporate insolvency is expected to rise 12% this year in the E.U., with most winding up in bankruptcy according to Eulier Hermes, a French credit insurance company. According to Standard and Poors, public European corporations with credit ratings below investment grade have a combined $72 billion of debt to refinance in 2012. S&P expects defaults to rise 8.4% among this group.
European banks were aggressive lenders to many of the eastern European countries that were formerly in the Soviet Union. Lending to eastern Europeans countries could drop by more than 30%, as banks try to strengthen their balance sheets. The countries most vulnerable are Slovakia, Hungary, and Romania. Poland, Bulgaria, and Serbia will be less affected. Even developed emerging economies India, Brazil, Indonesia, and China will feel the effects of Europe’s credit contraction. (Chart pg.4)
Pruning is another necessary job, if one wants a healthy garden of growing plants and flowers. Cutting off dead leaves and branches not only makes every plant look healthier, but can be essential in spurring more growth. In terms of tending to an economy, pruning is left to legislatures to enact intelligent regulations and adopt responsible fiscal policies. Needless to say, few politicians appear to be good gardeners, unless they are forced to act. Throughout the European Union politicians are moving to cut government spending and raise taxes in order to get their fiscal houses in order. Ireland has lowered its budget deficit from 32% of GDP to 10%, but its economy has contracted for three years. Portugal has cut public sector jobs and wages, but its debt to GDP ratio is 116% and its economy is expected to contract by 3% this year. Spain is enacting measures to restructure its banking system, which will likely take time and lower credit availability.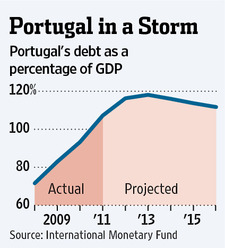 After contracting .3% in the fourth quarter, the International Monetary Fund estimates Spanish GDP will fall by 1.7% in 2012. In January, Italian Prime Minister Mario Monti announced a $7.1 billion infrastructure spending plan to boost Italy’s shrinking economy. The plan amounts to .03% of Italy’s $2.25 trillion economy. Despite this ‘stimulus’, the International Monetary Fund estimates Italy’s GDP will fall by 2.2%, or almost $45 billion. As a result, Italy’s debt to GDP ratio will rise further in 2012. The problem facing these countries is that the necessary pruning was not done when growth was healthy. Instead, the current round of pruning is occurring during a period of economic weakness, which will weaken growth in the short run and make lowering debt to GDP ratios more difficult. There are more chapters about Europe’s sovereign debt crisis to be written.
Getting rid of weeds is another necessary job, and there’s nothing fun about it. But it simply has to be done, if a garden is going to look good. A great deal of attention is focused on whether another bailout can be orchestrated for Greece. Compared to credit availability, Greece is small olives, whether a deal is made or not. Eventually, Greece is going to default. In the fourth quarter, Greece’s economy contracted at a 7% annual rate, and that’s before the next round of austerity measures are implemented. In Germany’s view, Greece is a weed that needs to be removed. Germany is demanding a level of austerity in Greece that will cause the Greeks to revolt, or cause the Greek economy to implode.
China
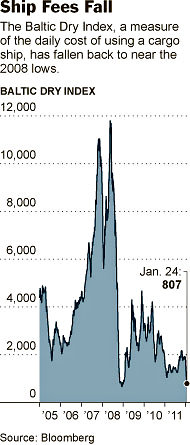 The Baltic Dry Index tracks worldwide international shipping prices of various dry bulk cargoes, in 26 shipping routes carrying a range of commodities including coal, iron ore, and grains. Over the years, the BDI has provided an indication of global growth, especially as China emerged as the dominant consumer of raw materials over the last decade. In recent months, the BDI has plunged leading some to conclude that it was signaling a hard landing in China. Although we expect China to encounter some problems in the next two years, we have not felt a hard landing was likely. The main reason the BDI has plunged is a dramatic increase in the supply of ships, rather than a sharp fall off in demand. Between 2006 and 2008, the BDI more than tripled, causing charter rates to soar from $10,000 a day to more than $60,000 a day for ships in the greatest demand. Believing demand from China would make the shipping nirvana last forever, ship owners went nuts, ordering a boat load of new ships. Those ships have been coming on stream forcing the charter rates to plunge. This year 1,650 large freighters for bulk commodities are expected to emerge from shipyards, increasing capacity by 10%.
 With demand only rising 2% to 3% last year, shipping rates and ship values have nosedived. Late last year, a large tanker that sold for $137 million in early 2008 was repossessed by the bank sold for $28.3 million. Big European banks were large lenders to the ship owners in 2007 and 2008, and according to Karatzas Marine Advisors, hold nearly $500 billion in shipping loans on their books. The banks may face upwards of $100 billion in losses in order to restructure these loans in coming years.
The real estate bubble in China has begun to deflate. We expect the Peoples Bank of China to cut rates and their reserve rates in 2012. These actions should help stabilize their economy, keeping growth in the 7.5% to 10.0% range. The risks however are to the downside. Europe is China’s largest export market, and if we’re right about Europe, Chinese exports will not rebound in 2012.
U.S. Economy
A number of better than expected economic reports, including the jobs report for January, have led economists to increase their growth estimates for 2012 to 2.5%. We think that will prove optimistic. Our expectation is that growth will gradually slow from the 2.8% level posted in the fourth quarter, and finish the year weaker than it started. In the fourth quarter, businesses added an annualized $56 billion to inventories, which contributed 1.9% to the 2.8%, or 67% of the gain in GDP. Unless sales pick up, companies will have to pare production to work off their inventories. At a minimum, inventory growth is unlikely to add as much as it did in coming quarters as it did in the fourth quarter. Although exports only account for 12% of GDP, they grew 15% in 2010 and 2011. However, Europe is our biggest trading partner and Europe’s growth rate will clearly be less than what it was over the last two years. Most of the export growth during the last two years has come from China, South Korea, Brazil, and India. Although all of these countries will continue to grow in 2012, each country is experiencing a slowdown relative to their growth in 2010 and 2011. The Dollar has risen 7% since last summer, which means our exports are more expensive than they were in 2010 and the first quarter of 2011, which will represent another headwind for further export growth.
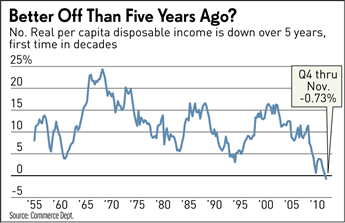 According to the Commerce Department, real (inflation adjusted) per capita disposable income fell .9% in the twelve months through November 2011 to $37,000. In September 2006, real per capita disposable income was $37,060. This is the first time since World War II that this income series has declined over a five year period. Wages and income for the average worker and family, after taxes and inflation, have not kept up with the cost of living over the past year, and barely for the past five years. This analysis assumes that the inflation figures used by the Commerce Department are an accurate representation of inflation. We could argue that the Commerce Department figures understate the true level of inflation most of us experience in the real world. We won’t bother, since most of you already agree with us.
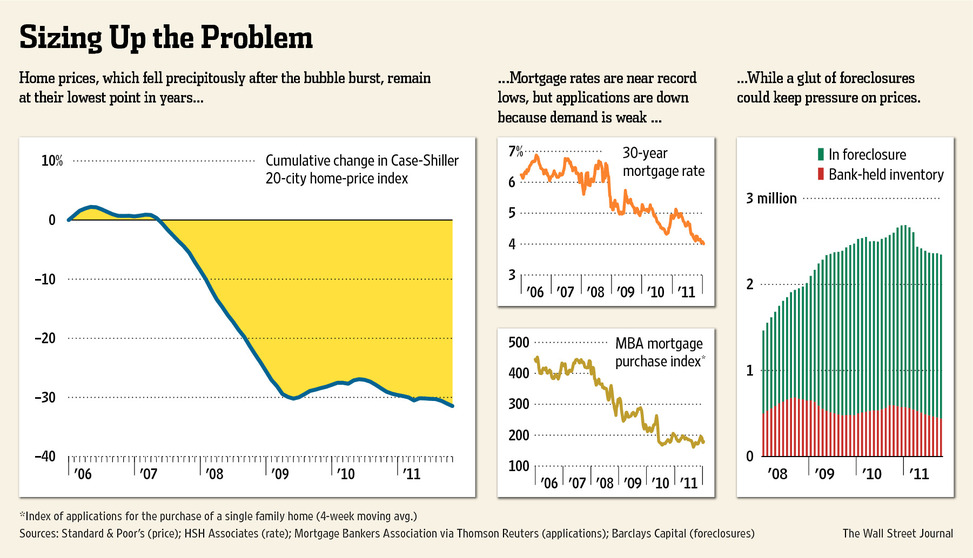 Since housing peaked in 2006, median home values have dropped 33%, wiping out more than $6 trillion in household wealth. Of the 57 million home owners with a mortgage, almost 11 million are underwater. Increasingly, home owners whose mortgage exceeds the value of their home by $50,000, $100,000, or more, are simply walking away and strategically defaulting. According to CoreLogic, home prices fell 4.7% last year, pushing more homeowners underwater. More than 60% of homes in the foreclosure pipeline have yet to be sold.
  As these properties are sold over the next two years, downward pressure on home prices will continue, especially in the most affected states. The important take away is that most consumers have taken a huge hit to their net worth, and negative psychology about housing is likely to be maintained in 2012. Consumer confidence remains under 80, which has only occurred when the economy was in recession over the last 40 years.
The January jobs report, which reported a gain of 243,000 jobs, was certainly good news. We suspect it may have overstated the true level of strength in the labor market, and won’t be maintained in coming months, if the economy gradually losses steam as we expect. The number of workers who have been unemployed for more than a year will remain depressingly high.
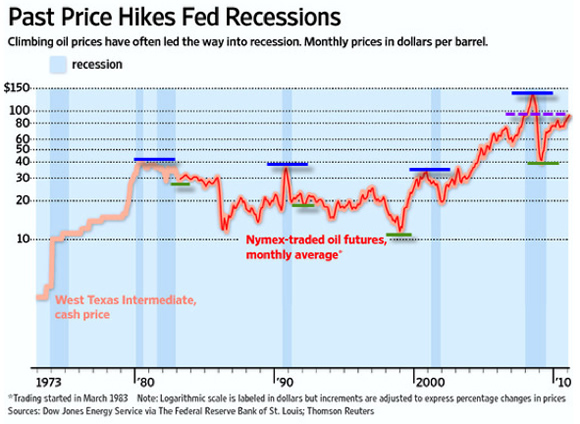
Historically, significant increases in the cost of oil and gasoline have preceded recessions. In the current environment, higher energy costs are more deflationary than inflationary, since they squeeze an already stretched consumer. Technically, an increase in oil above $104.00 could presage a run up to $114.00 a barrel, and would obviously be a negative for the economy.
Stocks
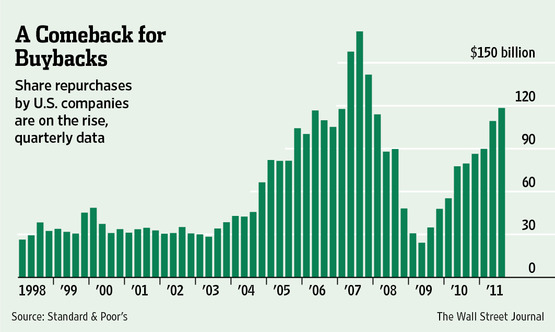 The stock market has gotten off to a great start this year. Coupled with better than expected economic reports a surge of optimism has investors focused on how much higher the market is likely to rise, rather than whether it will fall. Various measures of investor sentiment reflect a disproportionate level of bullishness. As noted in our February 1 Special Update, we think the market is forming at least a short term high, and vulnerable to a 4% to 7% correction. Comparing investor’s bullish outlook to the actions of corporate insiders also provides a note of caution. According to Vickers Weekly, corporate insiders have been selling 8 times the dollar amount of their purchases. In late September, they were only selling $.80 for every $1 of purchases. This suggests they think their stock prices have gotten ahead of where they think their businesses are going. This supports our view that the economy is likely to slow in coming months. It is also interesting to note that corporations were big buyers of their stock throughout 2011, especially in the fourth quarter. (Chart pg.8) However, the timing of corporate stock buy backs has not been good. They were huge buyers in 2007, just as the stock market was topping. At the bottom in 2009, their purchases were the lowest in 12 years.
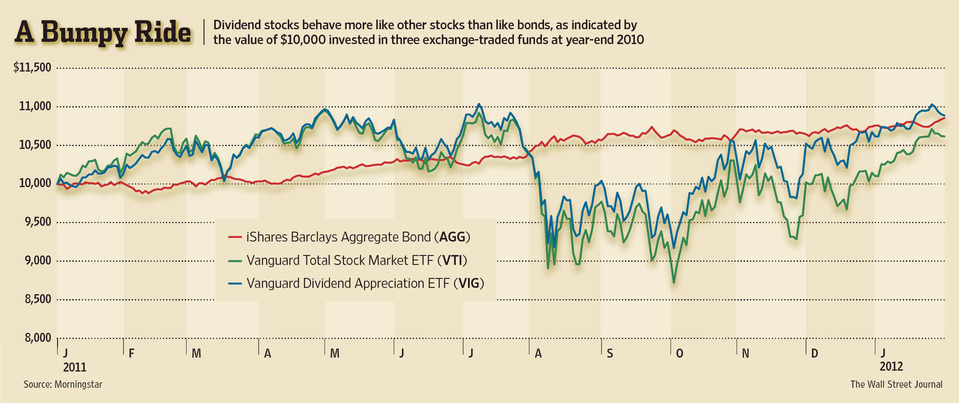
As we discussed last month, dividend paying stocks consistently underperformed non-dividend payers since 1978, as investors were more focused on growth than dividends. The period of relative weakness ended in 2000, at the peak of the dot.com mania. Since then, dividend paying stocks have been gaining in relative performance, and now sport the highest relative P/E ratio in more than 30 years. A recent study by AllianceBerstein ranked 650 large cap stocks by their dividends, and grouped them into quintiles. Currently, the premium of high-dividend payers over low-payers is the highest in 40 years. This fact alone does not mean this trade cannot continue to work, but a measure of caution is advised based on contrary opinion. We suspect this trade has attracted a lot of conservative money that is focused more on the income than the potential downside risk. If the stock market experiences another 20% decline in the next year, a dividend of 3% won’t provide much solace if one’s nest egg has shrunk by 17%. As the chart below illustrates, dividend paying stocks closely tracked the overall market, and fell quite hard when the market sold off in August and September last year. If there are more episodes to the European sovereign debt crisis and the U.S. slows as we expect, the odds favor the stock market being down 10% or more from current levels at some point before year end. Dividend stocks require as much sound money management as non-dividend stocks.
In the February 1 Special Update we suggested selling into strength over the next few days. On February 3 the S&P gapped above 1340 and hasn’t made much upside progress since then. Since institutional investors loath cash and are bullish, the market can hold up until more evidence of slowing in the U.S. economy emerge, and the expected resolution of Europe’s problems are challenged. A close below 1290 will increase the odds that a more significant top is in place.
Aggressive investors were advised in the February 1 Special Update to establish a short position in the S&P by buying the ETF SH, if the S&P traded above 1328, and to add to this position if the S&P traded above 1344. The S&P may have one more pop left that will carry it above 1355. If it does occur, add to the short at 1364, using a close above 1374 as a stop on the whole position. Cover half of the position at 1325, and the other half at 1313.00.
Bonds – In our November letter we suggested buying TLT, which is the ETF that mirrors the yield on the 20-year Treasury bond. On February 9 it closed at $115.49, which is the only day it has closed below our stop of $115.80. We think it will trade above the October high $125.03 before year end. Buy one third now, one third on a close below $115.49, and another third at $112.85, where there is a gap.
Dollar – In our May letter we recommended going long the Dollar via its ETF (UUP) at $21.56, and in our July 31 Special Update, we suggested adding to the UUP position below $20.91. The stop at $21.90 was triggered on February 7, when UUP closed at $21.89 and the only day it has closed below our stop. Repurchase UUP, using a close below $21.70 as a stop.
Gold – We recommend selling 65% of GLD purchased at $154.00 on the opening on December 30, which was $155.48, and to sell the remaining third on the opening of January 17, which was $161.17. If gold closes above the November high at $1804.00, it will likely run to the September peak near $1925.00. Buy a one third position in GLD if it closes above $175.55, using $160.00 as a stop. We are more comfortable waiting for a pullback later this year, especially if Europe’s sovereign debt crisis reignites as we expect.
Macro Tides



What's been said:
Discussions found on the web: