~~~
>
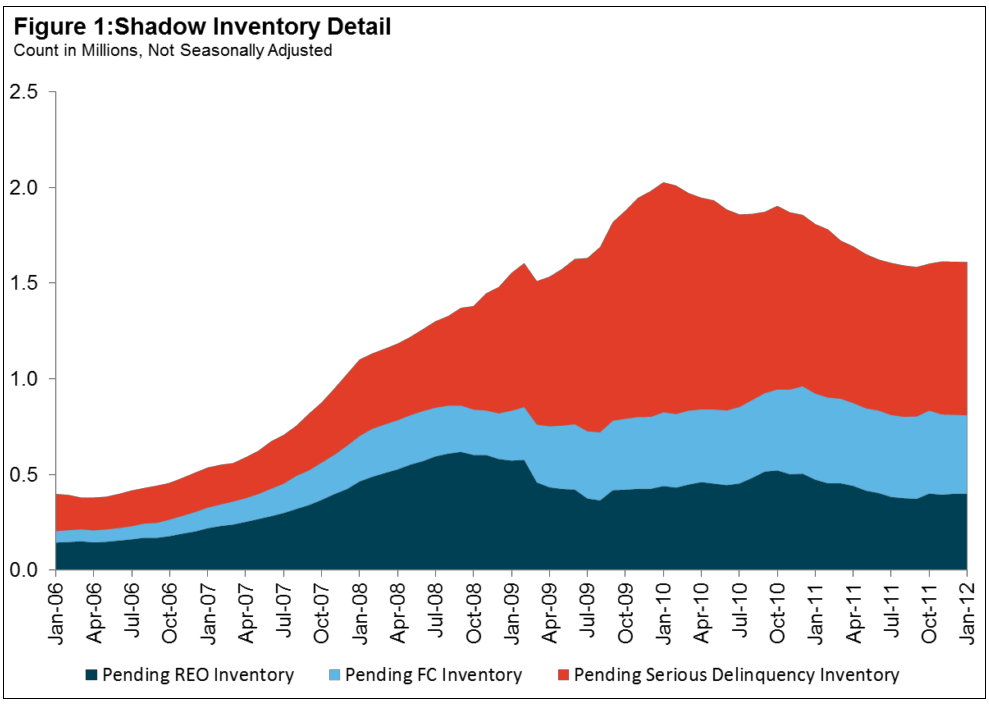
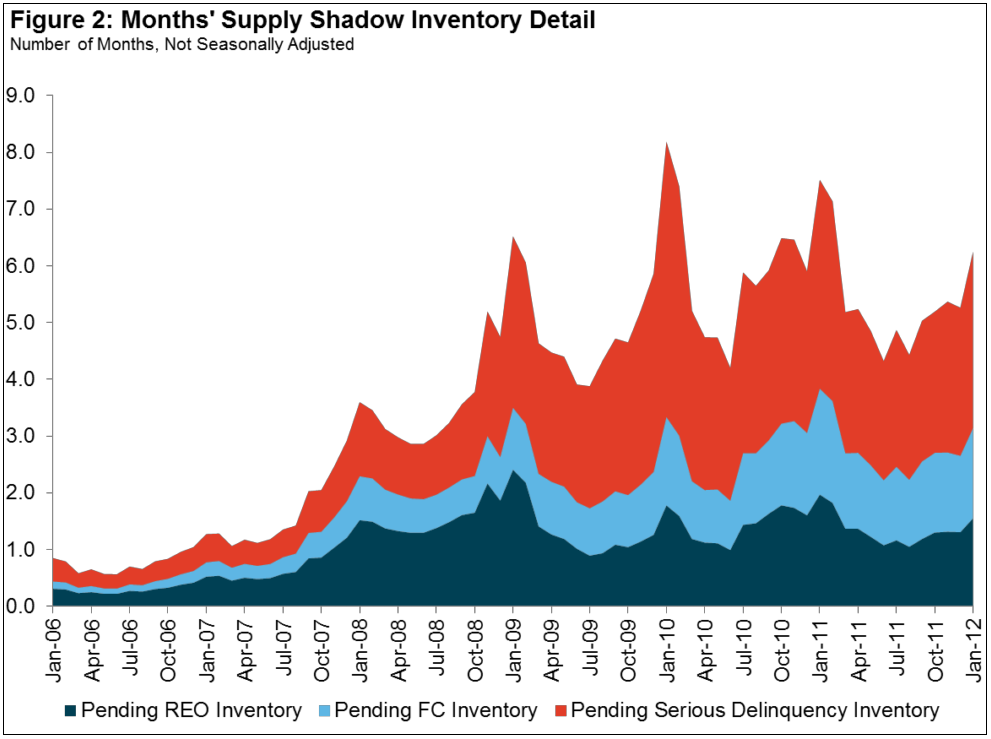
Since we are looking closely at RE issues this week, I wanted to take a look at CoreLogic’s most recent report on residential shadow inventory (January 2012).
Note that CoreLogic has a much more restrictive definition of Shadow Inventory than some other folks (including myself) do. They create an estimate of “Pending Supply” by calculating the number of distressed properties not currently listed on multiple listing services (MLSs) that are seriously delinquent, in foreclosure as well as real estate owned (REO) by lenders.
That formula yields them a count of 1.6 million units — or about a 6-month supply at current sales rates.
Other key data points CoreLogic:
• As of January 2012, shadow inventory remained at 1.6 million units, or 6-months’ supply and represented half of the 3 million properties currently seriously delinquent, in foreclosure or REO.
• Of these 1.6 million properties, 800,000 units are seriously delinquent (3.1-months’ supply), 410,000 are in some stage of foreclosure (1.6-months’ supply) and 400,000 are already in REO (1.6-months’ supply).
• Florida, California and Illinois account for more than a third of the shadow inventory.
• The top six states, which would also include New York, Texas and New Jersey, account for half of the shadow inventory.
• The shadow inventory is approximately four times higher than its low point (380,000 properties) at the peak of the housing bubble in mid-2006.
• Despite 3 million distressed sales since January 2009, the period when home prices were declining at their fastest rate, the shadow inventory in January 2012 is at the same level as January 2009.
• The shadow inventory is approximately half of the size of all visible inventory listings. For every two homes available for sale, there is one home in the “shadows.”
• The segment of borrowers that were 60+ days delinquent in the past but were “cured” and are now current on their payments is increasing. This figure was 7.2 percent in January 2012 up from 5.7percent a year ago.
• The total percent of borrowers who were ever 60+ days delinquent (irrespective of delinquency status today) increased to 15.5 percent in January 2012, up from 14.3 percent a year ago.
• The highest concentration of shadow inventory is for loans with loan balances between $100,000 and $125,000 (Figure 5).
• More importantly while the overall supply of homes in the shadow inventory is declining versus a year ago, the declines are being driven by higher balance loans. For loans with balances of $75,000 or less, however, the shadow is still growing and is up 3 percent from a year ago.
That’s probably more than you ever wanted to know about Shadow Inventory . . .
>
Source:
Shadow Inventory
CoreLogic March 2012 Report
http://www.corelogic.com/about-us/researchtrends/shadow-inventory.aspx#


What's been said:
Discussions found on the web: