
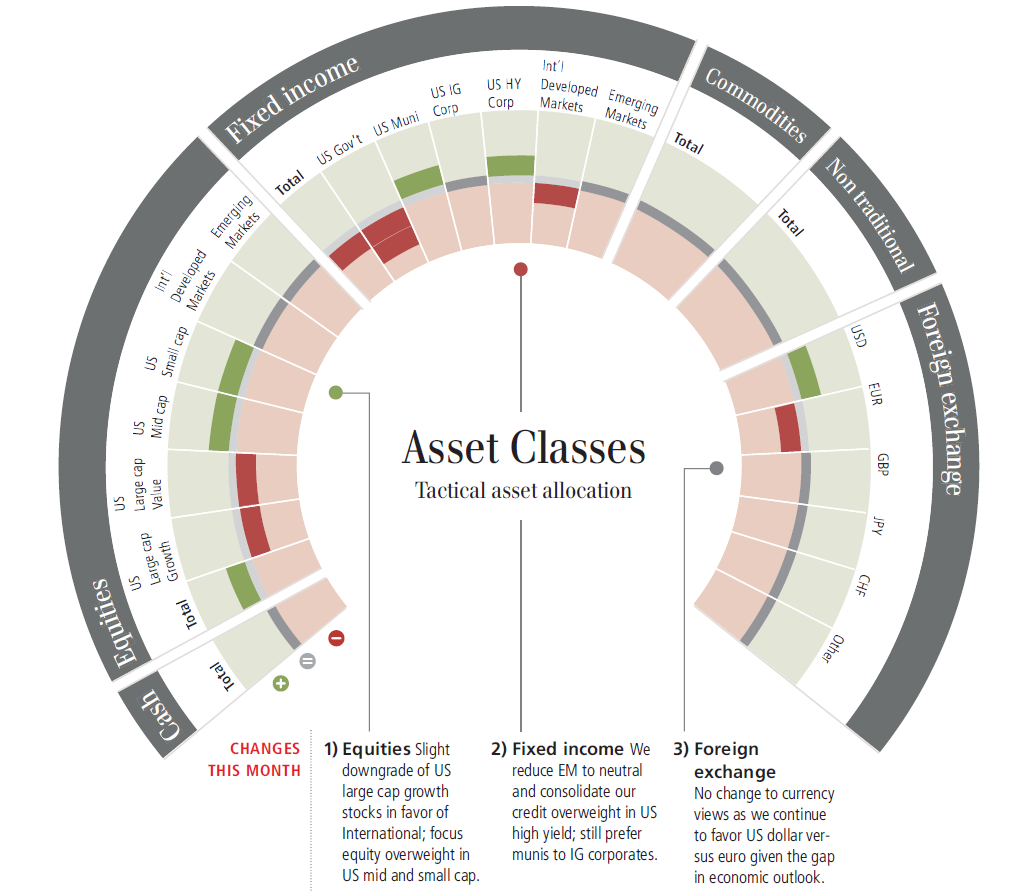
We have all seen the standard depiction of asset allocations — I thought this version — via UBS — was a more interesting depiction of the usual chart.
Click for ginormous graphic
Source:
UBS House View, July 2013
Mike Ryan
Monthly Investment Guide
CIO Wealth Management Research

What's been said:
Discussions found on the web: