
November 24, 2013
Unless the Fed Goes Cold Turkey on Us, Expect a Bountiful Economic Harvest for Thanksgiving 2014
If your Thanksgiving family dinner conversation is anything like mine this Thursday, it will be dominated by a discussion of how the U.S. economy and its financial markets will be behaving after nearly a year of Dr. Janet Yellen at the helm of the Fed. Well, I am going to give my family an advance copy of what I plan to say so that we can just concentrate on willing a Packers victory over the Lions. As a preview, I am bullish about what things will look like by Turkey Day 2014 even if Chairwoman Yellen becomes a little hawkish. (Perhaps too cute with the animal references?)
Let me explain. Monetary policy is all about modulating nominal aggregate transactions. Monetary policy affects the amount of a certain kind of credit created in the economy — credit that is created, figuratively, out of thin air. An increase in this thin-air credit enables the recipients of it to increase their purchases of goods, services and/or assets – physical and financial – without necessitating anyone else to correspondingly reduce his current spending/transactions. Regrettably, there do not exist data of total transactions in the U.S. economy. But there is a measure calculated by the Bureau of Economic Analysis that is an estimate of the nominal dollar amount of expenditures by U.S. residents on currently-produced goods and services, some of which are produced domestically, some of which are produced abroad. This measure is called nominal Gross Domestic Purchases.
Plotted in Chart 1 are year-over-year percent changes in quarterly observations of nominal Gross Domestic Purchases and the sum of Federal Reserve credit and depository institution credit from 1953:Q1 through 2013:Q2. As I have discussed ad nauseam in previous commentaries, both Fed credit and depository institution credit are created, figuratively, out of thin air. The measure of Fed credit included in the credit sum is another sum – the sum of Fed outright holdings of securities and Fed holdings of securities via repurchase agreements. The Fed’s current Quantitative Easing (QE) policy involves increased outright acquisitions of securities. Depository institution credit consists of the loans and securities on the books of institutions that issue deposits redeemable at par – commercial banks, saving institutions and credit unions. Since the S&L crisis of the early 1990s and the financial crisis of 2008, commercial banks account for the overwhelming largest component of depository institution credit.
Notice in Chart 1 that changes in the sum of Fed and depository institution credit, advanced by one quarter, has a correlation coefficient of 0.65 (out of a possible maximum of 1.00) with changes in the sum of nominal Gross Domestic Purchases. This correlation of 0.65 is higher than that obtained when the two series are compared on a coincident basis. This correlation is higher than that obtained when changes in nominal Gross Domestic Purchases is advanced one quarter relative to changes in the sum of Fed and depository institution credit. Thus, the evidence in Chart 1 suggests that not only do changes in nominal Gross Domestic Purchases and changes in the sum of Fed credit and depository institution credit move in close tandem, but also that changes in the sum of Fed and depository institution credit “cause” (in a statistical sense) changes in nominal Gross Domestic Purchases.
Chart 1


Plotted in Chart 2 are year-over-year percent changes in the sum of Fed and depository institution credit along with changes in depository institution credit by itself. From 1953 through 2008, the year-over-year percent changes in both of these series were very close to being equal. This implies that from 1953 through 2008, up until the recent financial crisis and the advent of QE, the behavior of depository institution credit dominated the behavior of the sum of Fed and depository institution credit. In other words, the Fed was providing a relatively small amount of “seed money” for thin-air credit creation to depository institutions. Depository institutions, operating in a fractional required reserve monetary system, were “multiplying” this Fed seed money into a much larger amount of thin-air credit to the non-depository-institution public.
Chart 2
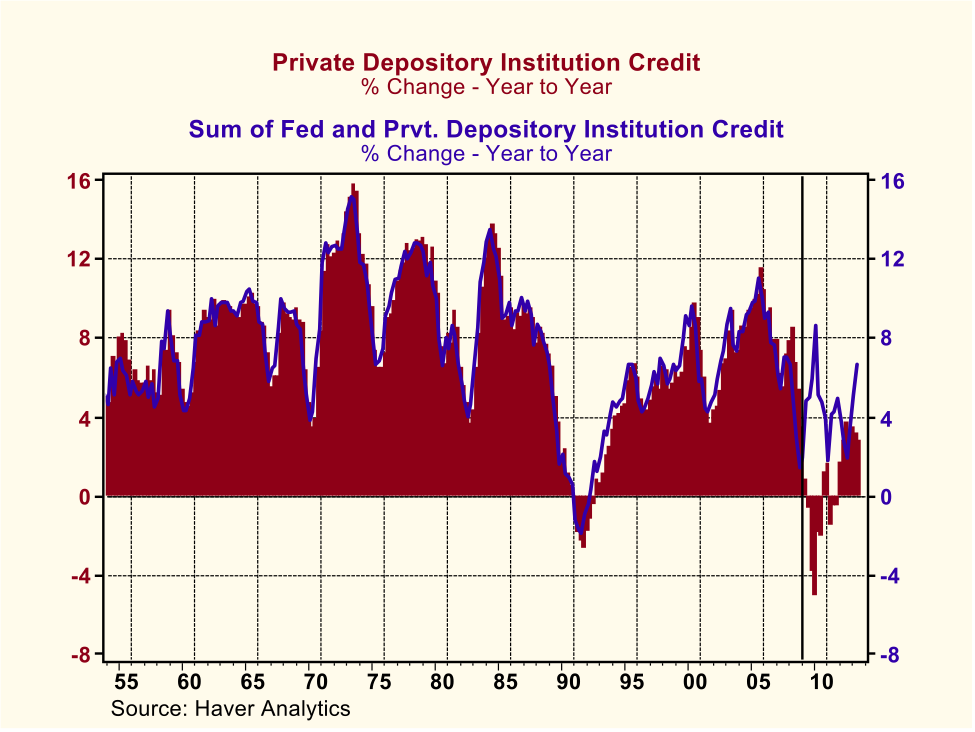
Chart 3 shows this more explicitly. Depository institution credit as a percent of the sum of Fed and depository institution credit has a median value of 92.3% from 1953:Q1 through 2013:Q2. In 2013:Q2, this percentage had dropped to a low of 78.2%. As implied in Chart 3, following the financial crisis of 2008, the Fed has become a considerably larger provider of total thin-air credit as private depository institutions have had to restrict their thin-air credit creation because of capital constraints resulting from loan losses as well as increased regulatory capital requirements.
Chart 3

Chart 4 shows the actual year-over-year percent change in quarterly observations of nominal Gross Domestic Purchases along with the predicted changes in the same. The predicted values were obtained from a linear OLS regression I ran with percent changes in nominal Gross Domestic Purchases as the dependent variable. The explanatory variables were a constant term, lagged percent changes in the sum of Fed and depository institution credit and lagged values of the percent changes in nominal Gross Domestic Purchases. Looks like a tighter fit than OJ’s glove, eh? The adjusted R-squared for this regression is 0.87, which means that the explanatory variables “explain” 87 percent of the variation in percent changes in nominal Gross Domestic Purchases.
Chart 4

Alright, so why am I bullish on nominal transactions for 2014? Because I am expecting the key “mover” of nominal transactions, the sum of Fed and depository institution credit, to average year-over-year growth from now through the end of 2014 slightly above its long-term median growth of 7.6% . Sustained growth in total thin-air credit of this magnitude has not occurred since the mid 2000s. I am making very conservative assumptions about the behavior of Fed credit and depository institution credit in my calculation of the projected sum of Fed and depository institution credit. I am assuming that the Fed will taper its net acquisitions of securities by $10 billion per month starting in January 2013 and taper further by another $10 billion per month starting in July 2014. In the 12 months ended October 2013, commercial bank credit increased 0.9%. I am assuming that depository institution credit will continue to grow at this modest rate. Chart 5 shows the actual year-over-year growth in the sum of Fed and depository institution credit from 2000:Q1 through 2013:Q2 and my projected growth in it from 2013:Q3 through 2014:Q4. The projected average year-over-year growth for the six quarters ended 2014 is 7.8%.
Chart 5

Plugging these conservative projected growth rates for the sum of Fed and depository institution credit into my aforementioned regression, I obtained forecasts of year-over-year percent changes in nominal Gross Domestic Purchases from 2013:Q3 through 2014:Q4. These forecasts, along with actual percent changes in nominal Gross Domestic Purchases starting in 2000:Q1 are shown in Chart 6.
Chart 6

Notice that the forecast shows a rising trend in year-over-year growth in nominal Gross Domestic Purchases in the (shaded) 2013:Q4 through 2014:4 period. For 2014:Q4, the year-over-year growth forecast for nominal Gross Domestic Purchases is 7.2%, the fastest year-over-year growth since 7.6% in 2005:Q4.
Now, I do not view the point forecasts of nominal Gross Domestic Purchases as the Gospel. But I do believe that the projected rising trend in the growth of the sum of Fed and depository institution credit does portend a rising trend in the growth of nominal Gross Domestic Purchases. Moreover, I believe that my growth projections of the sum of Fed and depository institution credit are very conservative. Given the capital-raising campaigns undertaken by U.S. depository institutions in recent years, given the diminished uncertainty about future regulatory capital requirements and given the rising trend in residential real estate prices, I believe that depository institutions are more able to step up their credit creation. Lastly, if I have erred in my projection of Fed credit, I suspect I have erred on the side of restraint. It is not a done deal that the Fed will commence a tapering in its securities purchases in the December 2013 or January 2014, as I have assumed, especially given how low consumer inflation is. For example in the three months ended October, the All-Items CPI increased at a compound annualized rate of 0.8%; the CPI ex Food & Energy at 1.5%. If the Fed were to delay its initial round of tapering until March 2014, it also would likely delay its second round of tapering – i.e., initiating an additional amount per month of reduced securities purchases – until after July 2014.
My projection of a rising trend in the growth of the sum of Fed and depository institution credit has a positive implication for the prices of U.S. risk assets – equities, high-yield bonds, real estate and maybe even commodities. The recipients of this projected rising trend of thin-air credit are going to purchase something with it. If the borrowers purchase currently-produced goods and services, this would result in higher corporate profits, which, in turn, would be positive for equities and high-yield bonds. The recipients of this increased supply of thin-air credit might purchase risk assets directly. After all, margin credit is on the rise.
What my projection of a rising trend in the growth of the sum of Fed and depository institution credit has a distinctly negative implication for are the prices of investment grade fixed-income securities. The likely faster growth in nominal aggregate demand will have a “multiplier” impact on the effective demand for credit. That is, as growth in sales of goods and services increases, businesses will be induced to borrow more to expand the scale of their operations. Household creditworthiness will improve, inducing them to activate their latent demand for credit. Rising credit demand will put upward pressure on interest rates, especially interest rates on longer-maturity securities. Presumably, interest rates on short-maturity securities will be held in place by the Fed’s continued zero-interest-rate policy (ZIRP). But, speaking of ZIRP, growth in nominal domestic aggregate demand higher than what the consensus and the Fed expect (is making a distinction between consensus expectations and Fed expectations a distinction without a difference?), which is my expectation, will cause the consensus to move up in time the forecast for the first Fed interest–rate hike and, therefore, revise up the level of the expected future course of short-term interest rates. This will put upward pressure on the current levels of longer-maturity interest rates. Lastly, stronger-than-expected growth in nominal domestic aggregate demand would likely result in an upward revision in inflation expectations, also putting upward pressure on the current levels of bond yields.
So, as you gather around the dining table with your family this coming Thursday to enjoy your Thanksgiving feast, you can reflect on not only your good fortune in 2013, but look forward to an even more bountiful “harvest” at Thanksgiving 2014, thanks, in no small part, to the generosity of the Federal Reserve. But you might want to “put up” more of that expected bountiful 2014 harvest because the Fed’s generosity will already have waned around the time of Thanksgiving 2014. The Fed is likely to become downright miserly soon thereafter, which implies that 2015 will be a much leaner year.
Paul L. Kasriel
Econtrarian, LLC
Sturgeon Bay, WI

What's been said:
Discussions found on the web: