
A Market Indicator That Predicts Nothing
Its predictive value is minimal.
Bloomberg, April 29, 2015
Every now and again, a way of looking at markets suddenly gains traction. Data gets assembled, analyzed, reviewed. Eventually, it becomes the basis of traders’ decision-making process. It even can become part of Wall Street lore.
The problem that arises all too often is that this approach is statistically bogus. The data gets cherry picked; backward-looking analysis gets form-fitted to what just happened and has no meaning for what is most likely to happen in the future. Confirmation bias and selective perception can lead an investor to lose objectivity, choosing an approach that justifies an existing portfolio mix, as opposed to objectively evaluating the data.
Consider as an example the ominous-sounding Hindenburg Omen, a technical analysis that purports to signal the likelihood of a market crash. That’s exactly what it’s been doing — unsuccessfully — since 2010. This sort of recession porn allows people to confirm their existing prejudices. After five years of money-losing forecasts, the Hindenburg Omen’s following among traders is fading.
But many other dubious or disproven metrics are still out there. Consider the Murdoch Indicator, or the Super Bowl Indicator, or the Mascot Indicator or even the Ticker Tape Parade Indicator. A decade ago, I termed this phenomenon YAII — for Yet Another Idiotic Indicator.
The most recent such metric? New York Stock Exchange margin debt. (Margin debt is when an investor borrows against the stocks he owns to buy more shares.) Margin debt has reached an all-time high and, as we have been told repeatedly, this is a fatal sign for markets.
There are two problems with this: The first, and lazier criticism, is to point out that analysts have been discussing the danger of this for at least the past four years (see chart below from two years ago). Margin debt was cited as a precursor to doom in 2011 and 2013 and last year and again a few days ago.
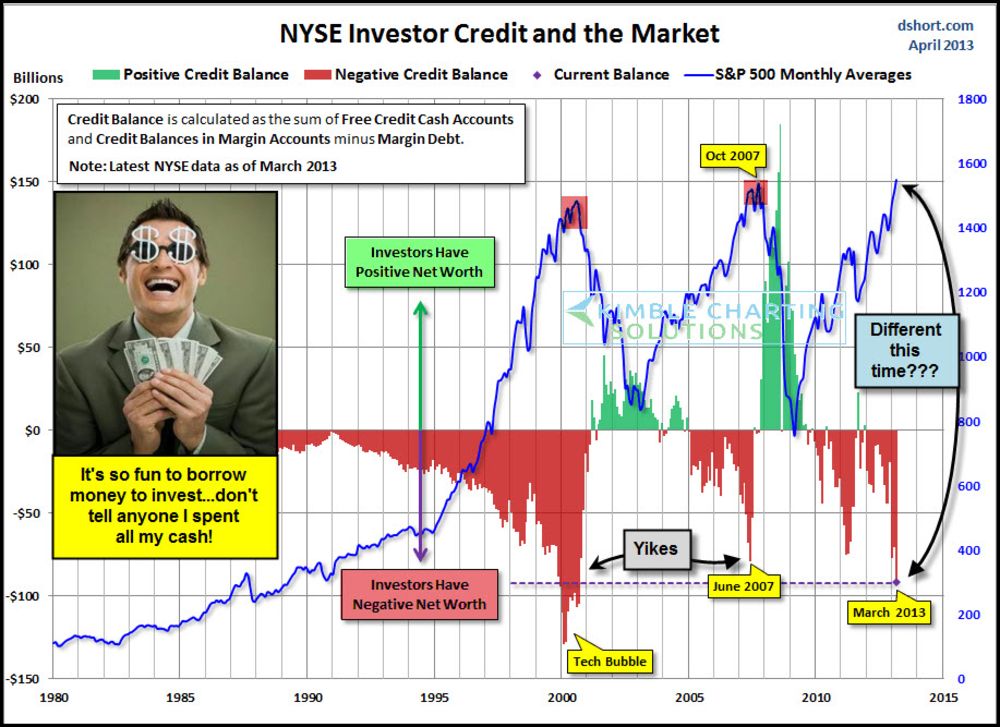
The more substantive analysis is to note that this is a correlation without much predictive value. It is a coincidental, not a leading indicator. Check the historical data and you will find it gives little warning of an imminent market crash.
Let’s delve into the details:
Margin debt rises and falls with markets. The basis for making loans against equities naturally increases when the value of that portfolio goes up. Margin debt declines when the value of that underlying collateral goes down. No big surprise; that is how margin works.
However, it is a double-edged sword. It can help drive buying during a bull market; during a bear market it does the opposite, pushing prices lower. It gets ugly during a retreat, when falling equity prices lead to so-called margin calls and forced selling. The rules generally don’t permit margin debt to exceed 50 percent of the shares pledged as collateral.
So why don’t I consider margin debt a valid indicator? Because as markets reach new highs, so too does margin debt. As we have previously discussed, new highs are a good thing.
During a bull market, those new highs occur with regularity. As my colleague Josh Brown notes:
On a daily basis, the S&P 500 trades at an all-time high 7% of the time and trades within 5% of an all-time high 36% of the time. This means that on 43% of all days, since the S&P 500’s inception, US large cap stocks were at or close to making new records.
It should come as no surprise then that NYSE margin debt keeps rising.
There is also a newer, related factor: the current, lucrative business of using portfolio equity as collateral for non-stock lending. Securities-based lending programs exist at financial outfits such as Wells Fargo, Merrill Lynch, UBS, and Morgan Stanley. It has been called the “rich man’s subprime,” and has recently attracted the attention of regulators.
It is worth noting that margin debt is relatively small. At the end of last month, NYSE margin debt was $476.4 billion, according to NYSE Data.com. This is against a total market value for NYSE-listed stocks of $16.6 trillion. Margin debt is less than 3 percent of the total NYSE capitalization.
I know, subprime mortgages were small as well. But those loans extended credit to people who couldn’t repay, whereas margin loans are usually made to well-off people against their own assets.
One day, this bull market will end. Whether it will be triggered by the Federal Reserve raising rates, accelerating inflation, valuation concerns or some geopolitical event is unknown today. But there will be an end, perhaps even a crash. History suggests that NYSE margin debt will be at all-time highs when that happens. But I strongly doubt its absolute level will give you much of a warning.
