
Is Cheaper Oil Good News or Bad News for U.S. Economy?
Jan Groen and Patrick Russo
Oil prices have declined substantially since the summer of 2014. If these price declines reflect demand shocks, then this would suggest a slowdown in global economic activity. Alternatively, if the declines are driven by supply shocks, then the drop in prices might indicate a forthcoming boost in spending as firms and households benefit from lower energy costs. In this post, we use correlations of oil price changes with a broad array of financial variables to confirm that this recent fall in oil prices has been mostly the result of increased global oil supply. We then use a model to assess how this supply shock will affect U.S. economic conditions in 2015.
We follow the approach in Groen, McNeil, and Middeldorp (2013) to distinguish demand and supply shocks on oil prices using correlations of oil price changes with a large number of financial variables. The assertion is that oil demand and supply shocks generate different price movements across these variables. Note that we use the Brent benchmark oil price this time instead of the West Texas Intermediate (WTI) oil price because the Brent price more accurately reflects other global benchmark measures. Furthermore, we expand the number of asset prices considered and extend the data set back to 1986.
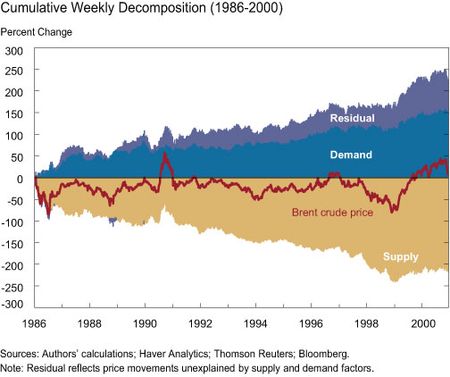
The chart below shows oil price changes along with the identified supply and demand drivers of prices cumulated from 1986 to 2000. The decomposition has supply side shocks driving the drop in oil price in the late 1980s and late 1990s as OPEC members, in particular Saudi Arabia, aggressively expanded their oil production.
In the 2001-2009 period, shown below, we find that weaker demand drove oil prices downward during the 2000-2001 U.S. recession and the 2007-2009 Great Recession, and then pushed prices higher during the subsequent recoveries. Tighter global oil supply put persistent upward pressure on prices over this period.

Finally, looking at the period from 2010 to the present, shown below, both rising global demand and some supply side pressures pushed oil prices higher until 2012. Since then, expanding oil supply has resulted in downward pressure on oil prices, an effect that, up until mid-2014, was counterbalanced by increasing global oil demand. Following the summer of 2014, however, Saudi Arabia announced that it would no longer cut production to prop up prices and this supply shock pulled down oil prices in the second half of 2014.

So, how does the U.S. economy tend to react to oil supply shocks? We use a statistical model with data from the fourth quarter of 1986 through the first quarter of 2015 that includes GDP growth, PCE growth, and nonresidential business fixed investment growth, with the latter split up into two components, the oil and mining sector and non-oil investment spending. The model also includes consumer sentiment, the real trade-weighted dollar index, trade volume (the sum of export and import volumes) of autos, capital, and consumer goods, and the real energy costs for households. The model is of the “vector autoregressive” (VAR) variety, where each variable depends on its own lagged values and those of all other variables.
We use our estimated supply component of oil price changes as an instrumental variable on the unexplained part of the model (the residuals), under the assumption that this supply component correlates with unexpected movements in households’ real energy costs due to oil supply.
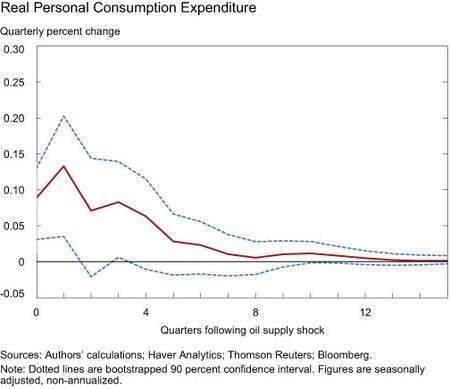
The three charts below depict how the non-annualized growth rates of GDP, consumption, and nonresidential investment respond to a one-standard-deviation movement in the households’ real energy costs residual caused by an expansionary oil supply shock. (The most recent positive oil supply shocks were close to two and one standard deviations in size in the final quarter of 2014 and the first quarter of 2015, respectively.) That model has GDP and consumption reacting quite modestly, with a maximum acceleration of growth of around 0.13 percent in a quarter in response to a one-standard-deviation supply shock. Nonresidential investment has a larger maximum acceleration.

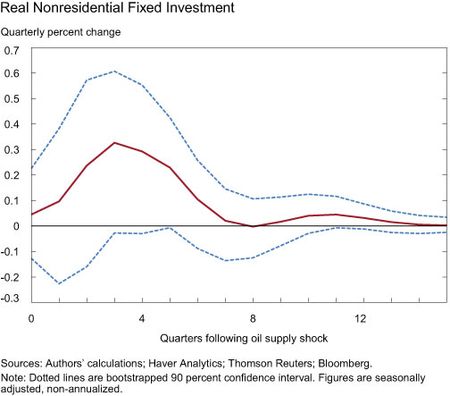
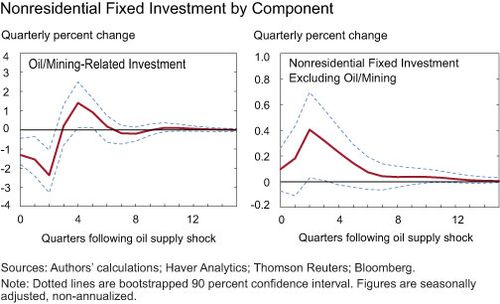
The nonresidential fixed investment response is the weighted response for oil and mining sector investment and non-oil-related investment. The two charts below show that oil-related investment spending shrinks substantially for the first two quarters after a one-standard-deviation expansionary oil supply shock, reaching -2.4 percent by the second quarter, before rebounding in the following quarters. This, and the delayed response of non-oil investment, explains why we would expect overall investment spending to peak later than GDP and consumption, following a positive oil supply shock.
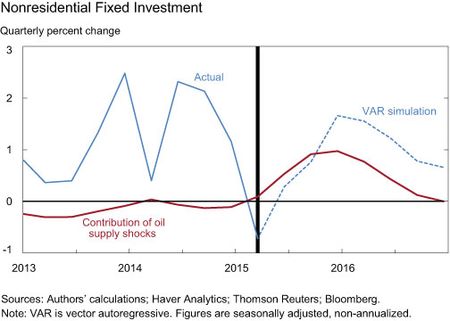
The model can be used to understand current and future responses of the economy to the most recent oil supply shock. The three charts below show actual (non-annualized) growth rates (the solid blue lines), simulated growth rates using the VAR model assuming no additional shocks after the first quarter of 2015 (the dotted blue lines), and the contribution of our estimated oil supply shocks up to these actual and simulated growth rates (the red lines). The oil supply shocks of the fourth quarter of 2014 and first quarter of 2015 have the strongest positive effect on GDP in the second quarter of 2015, whereas for consumption (the middle chart) the oil supply shock contribution peaks in the first quarter of 2015. Nonresidential investment growth is also boosted in 2015, with the initial contraction of oil-related investment resulting in a later peak for investment spending in the fourth quarter of 2015.


Our analysis suggests that the expansionary oil supply shock of late 2014 and early 2015 will have a relatively modest stimulative impact on economic activity, which will peak around mid-2015, and the effects should dissipate significantly by early 2016.
Disclaimer
The views expressed in this post are those of the authors and do not necessarily reflect the position of the Federal Reserve Bank of New York or the Federal Reserve System. Any errors or omissions are the responsibility of the authors.
Source: Liberty Street Economics
