This content, which contains security-related opinions and/or information, is provided for informational purposes only and should not be relied upon in any manner as professional advice, or an endorsement of any practices, products or services. There can be no guarantees or assurances that the views expressed here will be applicable for any particular facts or circumstances, and should not be relied upon in any manner. You should consult your own advisers as to legal, business, tax, and other related matters concerning any investment. The commentary in this “post” (including any related blog, podcasts, videos, and social media) reflects the personal opinions, viewpoints, and analyses of the Ritholtz Wealth Management employees providing such comments, and should not be regarded the views of Ritholtz Wealth Management LLC. or its respective affiliates or as a description of advisory services provided by Ritholtz Wealth Management or performance returns of any Ritholtz Wealth Management Investments client. References to any securities or digital assets, or performance data, are for illustrative purposes only and do not constitute an investment recommendation or offer to provide investment advisory services. Charts and graphs provided within are for informational purposes solely and should not be relied upon when making any investment decision. Past performance is not indicative of future results. The content speaks only as of the date indicated. Any projections, estimates, forecasts, targets, prospects, and/or opinions expressed in these materials are subject to change without notice and may differ or be contrary to opinions expressed by others. The Compound Media, Inc., an affiliate of Ritholtz Wealth Management, receives payment from various entities for advertisements in affiliated podcasts, blogs and emails. Inclusion of such advertisements does not constitute or imply endorsement, sponsorship or recommendation thereof, or any affiliation therewith, by the Content Creator or by Ritholtz Wealth Management or any of its employees. Investments in securities involve the risk of loss. For additional advertisement disclaimers see here: https://www.ritholtzwealth.com/advertising-disclaimers Please see disclosures here: https://ritholtzwealth.com/blog-disclosures/
So the data only goes back to 1985. Since we’re looking at the end of a secular bear market, wouldn’t the data from the late 70s and early 80s be useful?
Everybody is bearish but mutual funds’ equity allocation is near all time high, and cash near all time low.
Suggestions:
1. Pay attention to what they do, not what they say.
2. When the trend turns (and despite what Draghi and Yellen keep promising, it will turn) people will channel this extreme fearfulness into an avalanche of sales, which, coupled with MoMo algos and HFTs may very well cause 1987-like event.
Well, that might have helped caution folks from buying boatloads of Webvan in late-1999, but I think I’d have to get a much better look under-the-hood of this chart before I used it to influence investment planning.
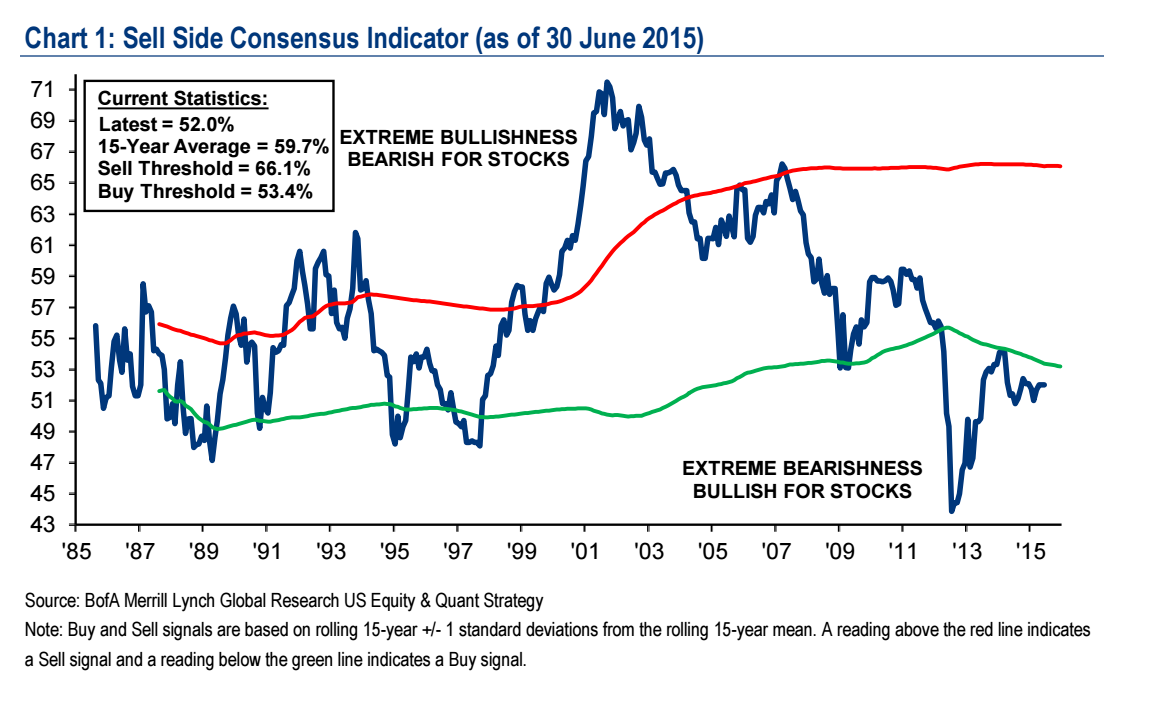


Look interesting but I don’t trust the sources.
It’s one metric, but their research team is first-rate.
So the data only goes back to 1985. Since we’re looking at the end of a secular bear market, wouldn’t the data from the late 70s and early 80s be useful?
Everybody is bearish but mutual funds’ equity allocation is near all time high, and cash near all time low.
Suggestions:
1. Pay attention to what they do, not what they say.
2. When the trend turns (and despite what Draghi and Yellen keep promising, it will turn) people will channel this extreme fearfulness into an avalanche of sales, which, coupled with MoMo algos and HFTs may very well cause 1987-like event.
Well, that might have helped caution folks from buying boatloads of Webvan in late-1999, but I think I’d have to get a much better look under-the-hood of this chart before I used it to influence investment planning.