This content, which contains security-related opinions and/or information, is provided for informational purposes only and should not be relied upon in any manner as professional advice, or an endorsement of any practices, products or services. There can be no guarantees or assurances that the views expressed here will be applicable for any particular facts or circumstances, and should not be relied upon in any manner. You should consult your own advisers as to legal, business, tax, and other related matters concerning any investment. The commentary in this “post” (including any related blog, podcasts, videos, and social media) reflects the personal opinions, viewpoints, and analyses of the Ritholtz Wealth Management employees providing such comments, and should not be regarded the views of Ritholtz Wealth Management LLC. or its respective affiliates or as a description of advisory services provided by Ritholtz Wealth Management or performance returns of any Ritholtz Wealth Management Investments client. References to any securities or digital assets, or performance data, are for illustrative purposes only and do not constitute an investment recommendation or offer to provide investment advisory services. Charts and graphs provided within are for informational purposes solely and should not be relied upon when making any investment decision. Past performance is not indicative of future results. The content speaks only as of the date indicated. Any projections, estimates, forecasts, targets, prospects, and/or opinions expressed in these materials are subject to change without notice and may differ or be contrary to opinions expressed by others. The Compound Media, Inc., an affiliate of Ritholtz Wealth Management, receives payment from various entities for advertisements in affiliated podcasts, blogs and emails. Inclusion of such advertisements does not constitute or imply endorsement, sponsorship or recommendation thereof, or any affiliation therewith, by the Content Creator or by Ritholtz Wealth Management or any of its employees. Investments in securities involve the risk of loss. For additional advertisement disclaimers see here: https://www.ritholtzwealth.com/advertising-disclaimers Please see disclosures here: https://ritholtzwealth.com/blog-disclosures/
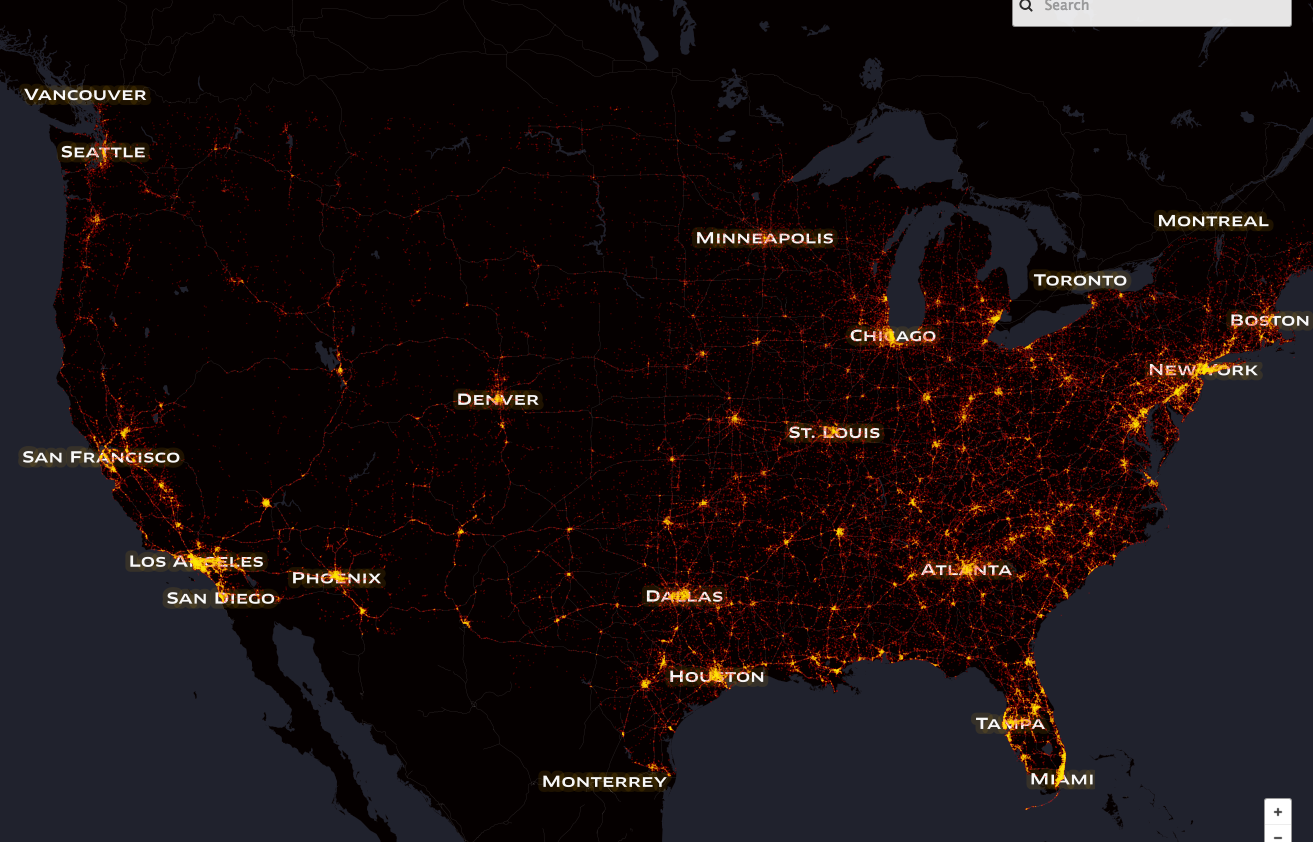
Nothing really earth-shattering to me here. Higher density population areas have more fatal accidents. I would expect to see a similar graphic for murders, gunshot deaths, STDs and anything else that people do to each other…. JMHO…
What matters for true comparison is the fatality rate. The rural states have higher a higher fatality rate, most likely due to lax seat belt laws. Every day there is news of people not wearing seat belts and being ejected from their pick-ups when they hit an unexpected curve or when involved in a crashes. In several of these rural states the cops cannot legally pull you over if you are not wearing a seat belt because they believe that is some sort of a personal freedom which needs to be protected.
I would also prefer to see a map of fatality rates, but should we look at rates by total population, by driving population (non-drivers die in traffic collisions, too), by miles driven, or some other metric?
Seat belts are important, but they are not the only factor. Rural populations will drive more on roads that are less safe – poorer lighting, with more disparities between traffic speeds (slow moving tractors or buggies sharing the road with cars and trucks travelling much faster, farther from ambulances and trauma centers, et cetera.


Nothing really earth-shattering to me here. Higher density population areas have more fatal accidents. I would expect to see a similar graphic for murders, gunshot deaths, STDs and anything else that people do to each other…. JMHO…
What matters for true comparison is the fatality rate. The rural states have higher a higher fatality rate, most likely due to lax seat belt laws. Every day there is news of people not wearing seat belts and being ejected from their pick-ups when they hit an unexpected curve or when involved in a crashes. In several of these rural states the cops cannot legally pull you over if you are not wearing a seat belt because they believe that is some sort of a personal freedom which needs to be protected.
Or maybe it is a cleanup of the gene pool.
I would also prefer to see a map of fatality rates, but should we look at rates by total population, by driving population (non-drivers die in traffic collisions, too), by miles driven, or some other metric?
Seat belts are important, but they are not the only factor. Rural populations will drive more on roads that are less safe – poorer lighting, with more disparities between traffic speeds (slow moving tractors or buggies sharing the road with cars and trucks travelling much faster, farther from ambulances and trauma centers, et cetera.
.
People in rural areas also have longer commute distances, higher a avg trip speed, and lack of safer mass transit options.
This XKCD comic is always the correct response to these maps:
https://xkcd.com/1138/