
Comment
http://www.arborresearch.com/bianco/?p=114434 has prompted many to ask why other economic numbers are not showing similar improvement, especially GDP. The consensus view is payrolls are “right” and GDP is “wrong”, meaning the economy is stronger than GDP suggests. We would argue the opposite as the BLS changed the way it conducts the establishment (payroll) survey starting in 2012. Let us explain.
Waning Productivity
When payrolls are strong and GDP is not, productivity declines. This is shown in the chart below.
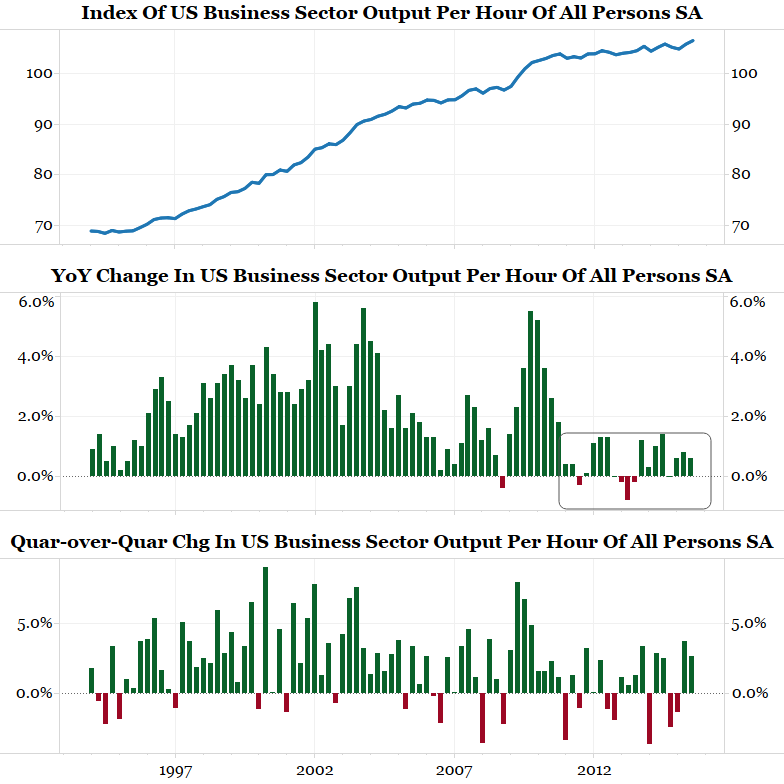
See the middle panel above. Year-over-year productivity growth has been a disappointment in recent years. Does anyone actually believe in this era of rapid technological advances that the U.S. economy has suddenly become that inefficient? We don’t and doubt that many do.
So how do we explain this? We first argued that something might not be right with the payroll report in December 2014 (and updated in May 2015). Below is an update.
Measuring Jobs
The BLS was created in 1915 to study jobs in four industries: boots and shoes, cotton goods, cotton finishing, and hosiery and underwear. Then, according to the BLS handbook:
During the Great Depression, there was controversy concerning the actual number of unemployed people; no reliable measures of employment or unemployment existed. This confusion stimulated efforts to develop comprehensive estimates of total wage and salary employment in nonfarm industries, and BLS survey data produced such a figure for the first time in 1936.
From 1915 to the early 1980s the BLS mailed a one-page form to roughly 60,000 establishments asking them for employment information. This data was compiled into the non-farm payroll report.
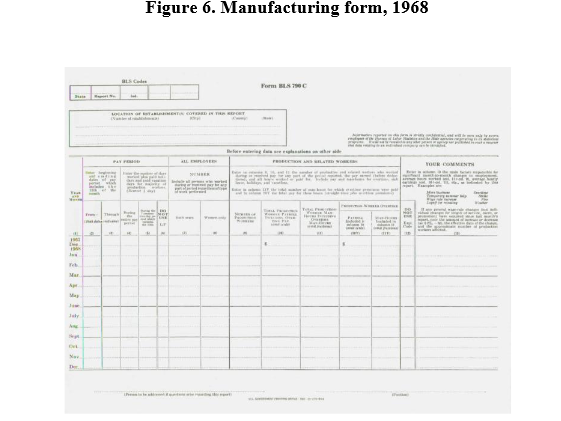
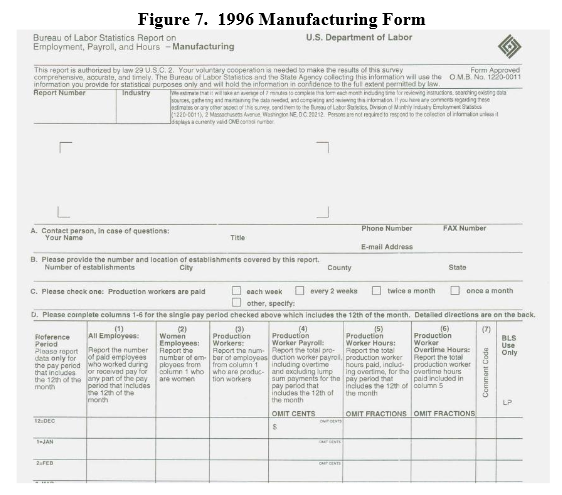
The one-page form used by the BLS was essentially unchanged from 1915 until it was revised in 2012 (no typo!). Below is how the form for manufacturing firms looked in 1947, 1968 and 1996. It is virtually the same form.

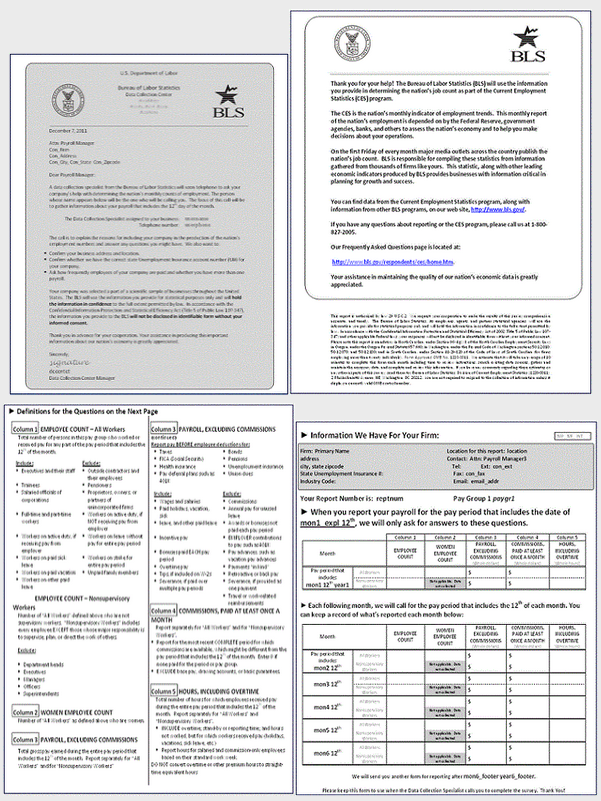
Starting in 2012 the form was changed to four pages:
Why was the form changed? As the BLS explained:
In 2008, the BLS started a research program to address problems with the design of the current form and produce a redesigned enrollment package. Objectives of the research were to improve efficiency of the interviewers through improved ability to explain the reporting task, to improve the respondent ’s comprehension of the task, and to decrease respondent burden.
Four goals for the redesigned package were identified. Two of the goals, items 3 and 4, were seen as significant for the project:
- Convince the recipient to open the package.
- Convince the recipient to read and attempt to understand the contents of the mail- out package.
- Provide a reasonably clear explanation of what the recipient is being asked to do.
- Persuade the recipient to comply with the request.
Research found five problems that affected the form’s ability to provide a reasonably clear explanation of the survey task:
- The cover letter is not well connected to the form.
- The reference period is not understood.
- Respondents do not understand that they will be called each month.
- Some respondents complete all months of reporting at once.
- The complexity of instructions for reporting multiple payrolls caused non- response.
Nowhere did they address the issue of results being skewed toward a positive response bias because of the new questions. In fact, here is what the BLS concluded about the new form:
We believe that the new form offers improvements in interviewer efficiency and data quality. These benefits include:
- Converting to a four page design eliminated a source of mismatched letters and forms.
- Improvements in Item Non-response were observed.
- Interviewers reported that it was easier to enroll firms with the new form.
- Kansas City and Niceville enrollment time results confirmed this observation. Collection times were also faster in Kansas City and Niceville.
- Response and Collection rates were similar between test and control samples.
- In other words, the BLS was looking to alleviate the burden of responding in order to reduce the cost of collecting the payroll report. Initially BLS interviewers will guide a firm through the process for the first 4 to 6 months to make sure they understand the process and do it correctly. After that they are added to the sample set and expected to continue responding on their own, without prodding from the BLS to fill out the forms.
- While this is a worthy goal, our inquiries to the designer of the new form and the BLS reveal that no one tested to see if this change would result in a response bias. We fear that it might have. Who takes the time to read the four page report and respond (as opposed to the more expensive process of a surveyor leading you through the process every month)? We believe the firms that have good news (i.e., hiring employees) are more likely to respond, hence a positive response bias.
- To be fair, the BLS says if there is a positive response bias, it would be corrected years later in the benchmark revisions (when tax and state unemployment data is added to the results to make them more accurate). This is true, but by then the data is considered old news for markets.
The Internet Changes Things
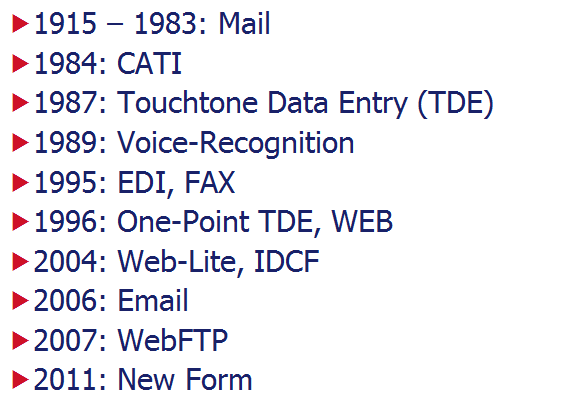
CATI = Computer Assisted Telephone interviews
EDI = Direct Electronic File Transmission
Web = via the internet
TDE = Touch-tone data entry
Mail = Traditional Mailing of Forms
Fax = Faxed responses
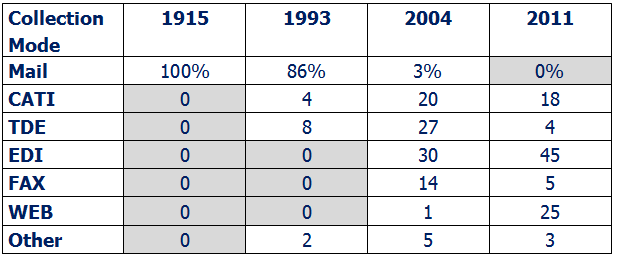
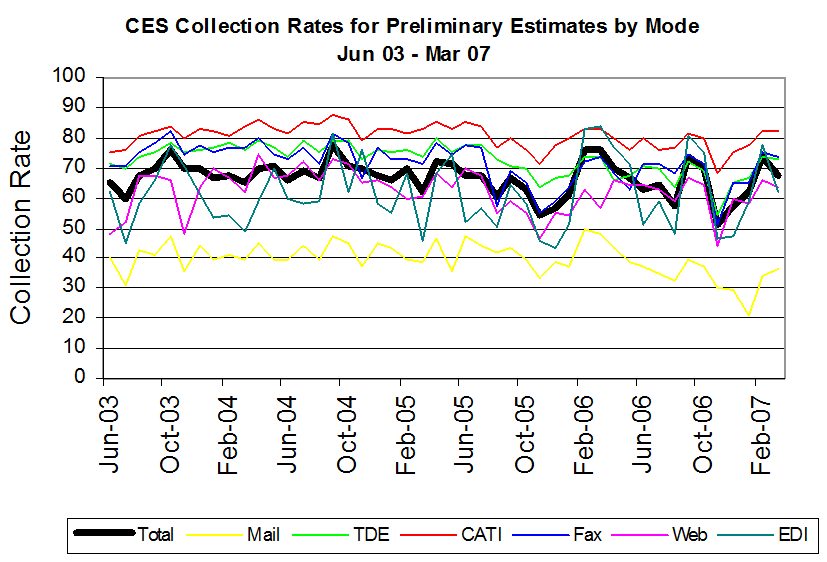
The chart below, from this 2007 study, shows the response rates for mail (yellow line) is much lower than other “modes” of collection. All the new modes of collection that have been developed and continue to be developed lead to higher response rates.
The advent of online responses has greatly increased the number of respondents in the preliminary release…
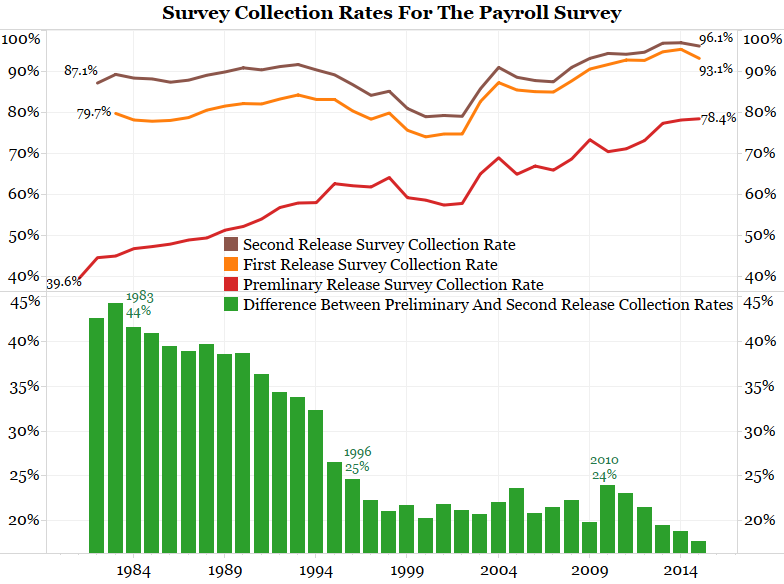
… and reduced the revisions to the report.
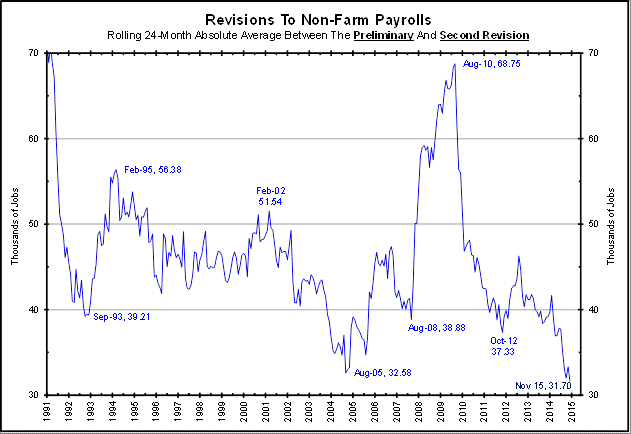
Conclusion
Does this represent a stabilization in the labor force? Or, has the new multi-mode collection and new 4-page form led to higher positive response rates, better measurements and the appearance of greater stabilization in the payroll report? While more accurate readings would definitely be a plus, are economists misreading higher payroll numbers and the smaller revisions as a positive sign for the economy? Do we have a series break in the data starting in 2012?
The problem is we do not have enough data to test this hypothesis. That said, we suspect the high payroll numbers of late could be due to improvements in data collection rather than actual improvement in the workforce. This would explain why productivity is so low.

What's been said:
Discussions found on the web: