
Short-term update: article right now final share of 2015 for Quantocracy. Also shared by Ritholtz (link forthcoming). Visit their websites and make sure to share this article. Thanks and happy holidays!
As we head into 2016, we can often look back at the past year and an overall history of rare events, and try to then extrapolate future odds of the same rare event, based on that. See this recent, confusing CNBC segment for example, where two Wall Street strategists (Tobias Levkovich and David Bianco) both mishandled their understanding of recent market data (facts) and how to think about their odds going forward (probability theory). What we will illustrate here is that recherché past events has no usefulness in understanding the rarity of the same events in the future! So the flat or worse 2015 for the markets would be rare to some degree, but that is just a trivial understanding that can’t be used to guess the future.
As a first matter, let’s put aside the technical aspects of the dispute on the CNBC video. The market hasn’t rarely been down or flat two years straight. Despite the long-term uptrend of the stock market, this rare streak has happened a bit since the S&P started in the early 1950s:
1956-1957
1969-1970
1973-1974
1977-1978
2000-2001-2002
2007-2008
We use any annual market change of within 3% (such as 2015) as the definition of flat. Also in 2001, we see this streak immediately repeat again (so which combination of two or three years should one use to data mine?) Now as a second matter, we should note that we are sitting at the end of 2015 (possibly within, as opposed to the end of, a 2-year or greater pattern). And one can’t simply set-up their backtest by mixing in other conditions that you feel like, such as recessions in that first of two years. So given that context, there is plenty of identical market observations from the past in which to backtest such asset allocation ideas. On an aside, Ritholtz (a Bloomberg contributor) gets it right if you want to stay locked at looking at responses to just 1-year flat periods in the market.
The larger scheme here is that these rare market statistics are (perhaps) fun to talk about, but have no predictive power for the future (other than in rare circumstances where one gets lucky). If any of the talking financial heads would confess to this, then there wouldn’t be anyone on Wall Street able to hawk excess trading and risk management services. After the global financial crisis that I worked on the rescue from, it’s easy to imagine that even those on Wall Street believe their own market prediction skills (here, here). And their complete failure again in getting the S&P target for 2015 (I meant 2016) is just the latest example of their shameful inabilities.
We’ll show that rare patterns in the past have nothing to do with rare patterns in the future. So any rare pattern can become rarer, less rare, or equally rare, going forward. And we’ll be able to construct a probability analysis that creatively bootstraps all of the past U.S. S&P data to show this.
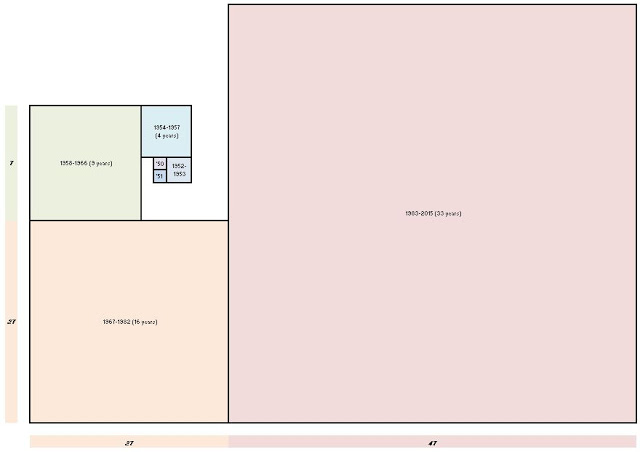
Since the start of the S&P, we have 66 years of market history through 2015. The backtest design is to always look at thecumulative history streak, and judge it’s rarity over the same amount of future time since then. Incidentally, unlike in the CNBC conversation linked above, this is the only correct way from a probability standpoint to perform this type of analysis! So we start with the 1-year period of 1950, and then judge the rarity of these streaks in the following 1-year period of 1951. Then we look at the cumulative 2-year period of 1950-1951 and contrast it with the following 2-year period of 1952-1953, and so forth.
The colorful illustration below (different from but similar concept to the Golden ratio φ of 1.618034…, while below we see it is a ratio of plainly 2) helps show these 6 generated time periods in which to test. The smallest period is actually ~252 days (1 year), but our probability set-up gives it the statistical power of nearly 11 years!
Looking at exotic trends is different from the simple, mainstream financial analysis which only (at best) looks at frequencies (here, here) or “reactions” to market changes (e.g., a scatterplot showing what generally happens the day after a market crash). We must appreciate that trends in black days do not always hold. Whether they are bundled into in cute engineering theories, such as a Black Swan model, designed to show humans can reach the breaking point and break through. Or whether they are enveloped into periods of policy change, such as 1987’s Black Monday, where the single day loss of more than 20% has never occurred since (not even during the wildest, 15 day stretch of 2008).
So over each of the 6 time periods identified, we measure the record number of days in each of the following 7 broad market patterns we analyze below (green is an up-day in the market and red is a down-day). What is shown is merely illustrative:
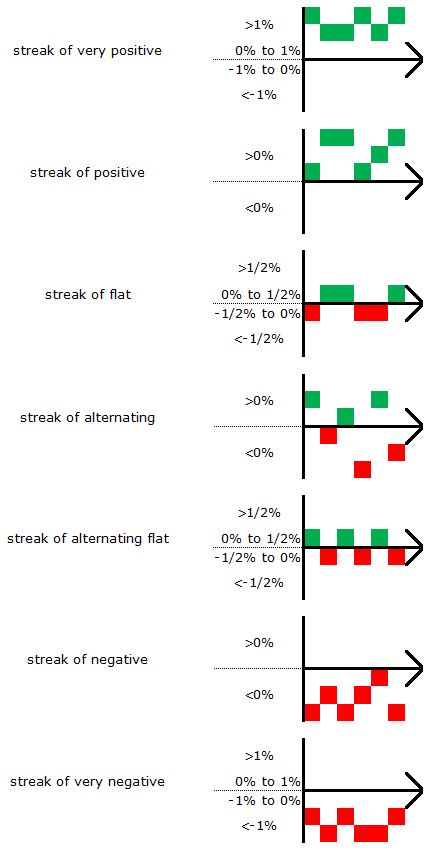
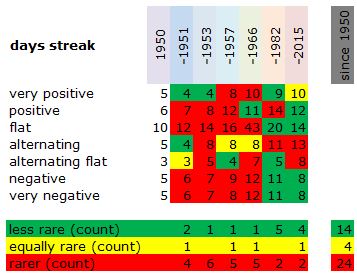
To read the results below, we can take the example of an “alternating”. In 1950 the lengthiest streak of this pattern was 5 days. The following year the lengthiest streak was 4 days (the new 4-day pattern is less rare). However in 1952-1953, the lengthiest streak surged to 8 days (a rarer streak was established versus the cumulative record of 5 days from the prior 2-year period of 1950-1951).
The results basically affirm that rarer records (shown in red) are the norm across all 7 events (which itself is highlysignificant to consider streaks run in all directions!) However, there has been a recent reversal where the market has seen smaller (less rare shown in green) streaks across all 7 events, despite all of the arguments about the effect of quantitative easing (here, here). One should balance this with their own intuition. While this reversal is significant, we can’t state with the sample -for this correct analysis- whether it is simply more random or if we can expect a trend in less rare events to go forward. Also notice that only scarcely does the streak pattern in the past stay the same (yellow color)… So much for pattern mining!
Only if the latter is true, we should see streak patterns arbitraged away. Nassim Taleb’s ideas would therefore be flawed relative to Eugene Fama’s efficient-market hypothesis, and we would expect that we see immensely random (regardless of any wild gyrations) markets for many years going forward. And flattish markets in 2015 would tell us absolutely nothing about 2016.
And with that, happy holidays! Looking forward to catching up in the new year.
Source: Statistical Ideas
