
click for ginormous graphic
Source: Calculated Risk
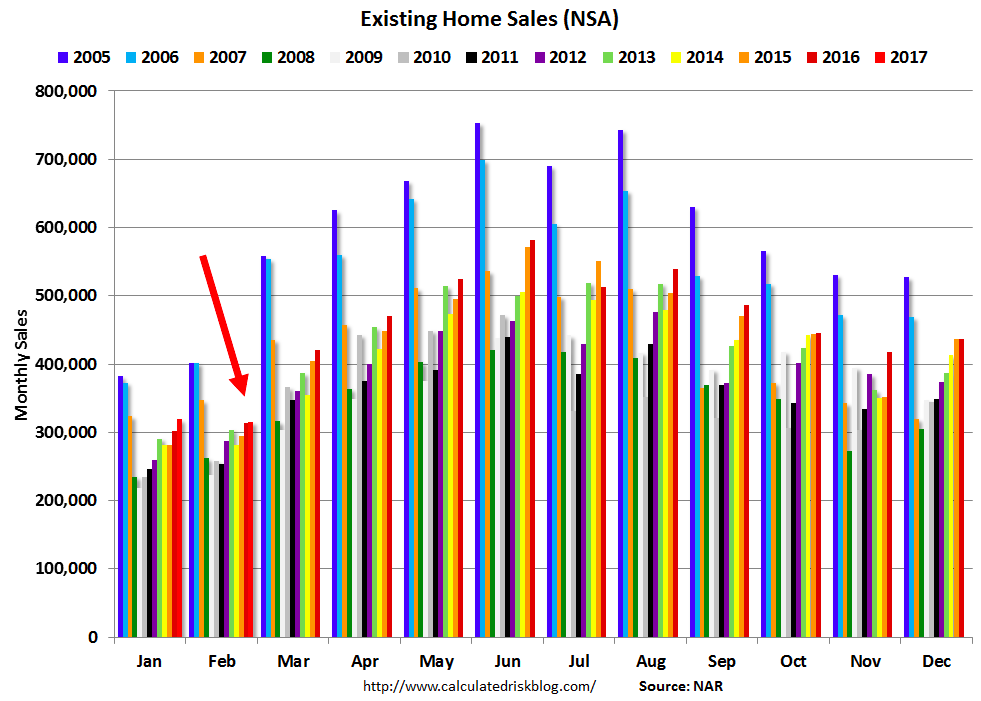
During the real estate bust — call it 2006 to 2010 — this was my favorite chart. It stripped out the seasonality (and related adjustments) and revealed what was actually happening in residential real estate.
Here is Bill of Calculated Risk:
The contracts for February existing home sales were entered after the recent increase in mortgage rates (rates started increasing after the election).
With the recent increase in rates, I’d expect some decline in sales volume as happened following the “taper tantrum” in 2013. This is the first month with softer sales (and it is just one month), so maybe sales will hold up.
Inventory is still very low and falling year-over-year (down 6.4% year-over-year in January). More inventory would probably mean smaller price increases and slightly higher sales, and less inventory means lower sales and somewhat larger price increases.
Previously:
Bill McBride and the Case for Facts
