
The Dumb Money Isn’t So Dumb
Individual investors haven’t abandoned the stock market. They’ve just gotten smarter about it.
Bloomberg, January 30, 2017
One of the things I try to accomplish with this column is to separate wishful thinking and fantasy from hard, cold facts. We have looked at the Hindenburg Omen, the Death Cross, even financial astrology. All have been found wanting.
It is a never-ending battle to keep junk out of the heads of traders and investors. Today’s example comes from Andy Kessler, who discusses what he calls the HQ Indicator in the Wall Street Journal:
Wall Street’s most successful players get ahead of the news, understand a CEO’s mind, and figure out where the company is going. To do this, I often use what I call the “HQ Indicator.” It’s for those playing long ball, not day traders, but it is simple. When a company announces it is moving its executives into a lavish palace, it’s often time to get out.
This falls into the category of those concepts that sound really intriguing, but don’t seem to survive close scrutiny. Like others before it, it is filled with all manner of statistical error and bias.
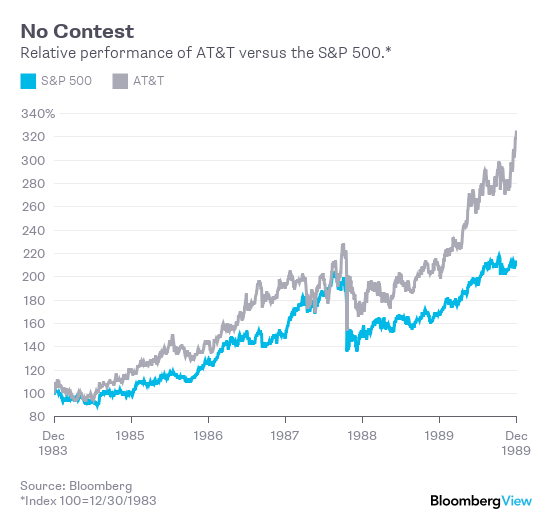
Kessler uses the new Salesforce Tower in San Francisco, as an example, along with a handful of cherry-picked others: the IAC Building in Manhattan (2007), the Time Warner Center (2003), the Bear Stearns Building (2002), the New York Times Building (2007) and the AT&T “Chippendale” Building (1984). These companies didn’t fare particularly well over the long term, and either disappointed investors or no longer exist.
He also cites the neo-Gothic Woolworth Building (1912) as a counter example. Woolworth had a good run after, but it is hardly the exception that proves the rule. Sears Tower in Chicago was finished in 1973, and the company had a great 30-year run before it stumbled in the 2000s. But look no further than Amazon.Com Inc.: employees started moving into its new new downtown Seattle headquarters in 2015. Maybe the company will crash and burn someday, but anyone who used the HQ Indicator as a bearish signal and sold Amazon shares short has long since been carried out on their shields.
As has been said before, the plural of anecdote is not data.
For the HQ Indicator to be a true data point rather than a mere anecdote, several things would need to occur:
No. 1: Define the terms in advance. Is the signal we are measuring the size, cost or architectural significance of a new corporate headquarters? If we want any indicator to be valid, we need a baseline that is more than just a gut reaction; it needs to be an objective measure of some factor rather than mere coincidence.
No. 2: Use a reasonable time period as a sample. I suggest any period that isn’t form-fitted to yield the desired result and includes at least a full cycle of ups and downs in the economy. For example, the period from 1980 to 1990 works; so does the period that encompasses the dot-com bust of 2000 to the present.
No. 3: Select a reasonable geographic region. Are we using a worldwide sample or confining it to national borders?
No. 4: Start with a broad data set. Use a group of stocks that isn’t a biased selection relative to the thesis. For example, the Standard & Poor’s 500 Index or the Russell 2000 Index both work. But whatever you do, don’t cherry-pick a few prominent examples while ignoring the remaining universe of publicly traded companies.
No. 5: Once you have your data set, you must determine which companies have built a new headquarters. Then you can run a comparison of their subsequent relative performance.
If you were to perform those five steps, you might have an objective measure of whether there is a HQ Indicator. Further, you could then perform out-of-sample tests — measure over different time periods and/or parts of the world, to see if the HQ Indicator is universal, or limited to a specific time and place.
Do all of that and you might even have the makings of a good academic paper.
One last thing: I have long been a part of the evidence-based investing movement. More and more investors are starting to take note. It’s why the dumb money isn’t so dumb any more, and why index investing has gained so much ground versus active stock-picking. Perhaps we should be teaching basic finance and simple statistics to high school students. More than avoiding bad indicators, they should understand compounding and savings before they take on enormous college debt.
You don’t need to be a quantitative wizard to avoid misleading investment memes. The next time you see an indicator that purports to have insight into the markets, ask yourself the five simple questions above. Your future self will thank you.
Originally: A Spurious Anecdote Masquerades as an Investment Signal
