
The Imaginary Debt Crisis Is Here to Stay
Household borrowing has reached new records. Big deal. Personal income has grown much more.
Bloomberg, August 16, 2017
Now that we have surpassed 2008 highs in household debt, I guess we are due for a panic attack.
Four times a year, the Federal Reserve Bank of New York’s Center for Microeconomic Data releases its “Quarterly Report on Household Debt and Credit.” Soon after, we get the freak out over the record amount of debt. Sometimes it’s merely sensationalistic headlines; other times it strays into flawed analysis. It often unnerves investors and policy makers, who then do silly things against their own interests.
That’s where we come in.
A single number seen in isolation might score some clicks, but it doesn’t help the average person understand the data. This “denominator blindness,” as we have called it before, is the failure to put large numbers into the appropriate context. When the Big Risk Fund loses $100 million; when Large Corp. cuts 1,000 jobs; or even when the Old Index loses 100 points, the lack of any frame of reference for those single numbers creates a misleading narrative.
Once upon a time, a 100-point decline was a lot when the Standard & Poor’s 500 Index was less than 1,000; but it’s barely a blip when the Dow Jones Industrial Average is higher than 22,000. If Wal-Mart Stores Inc. fires 1,000 people, it creates a personal disaster for the individuals, but it isn’t meaningful to a company that employs 2.3 million people.
Yet the understanding that all numbers need to be qualified continues to elude many people. “Consumer debt is at a record high. Haven’t we learned?,” screamed the Washington Post headline; a more restrained Reuters went with the less emotional but context-free, “Americans’ debt level notches a new record high.” I give credit to the Wall Street Journal for being more nuanced 1 in noting that “While overall debt has increased, the figures aren’t adjusted for the growth of the population or the economy. Total debt was 67% of the nominal gross domestic product in the second quarter, down from as high as 87% in 2009.” (emphasis added)
You can go through most of the first three dozen links in a Google News search of the term “household debt,” and article after article will omit the crucial question of Americans’ ability to service that debt — or make payments that cover current interest and principal. The ability to service that debt is central to understanding how and when borrowing becomes risky.
The chart showing record debt by itself is what comedian George Carlin used to call a “partial score.” 2 The complete score, of course, would include how you service that debt.
No Squeeze Here
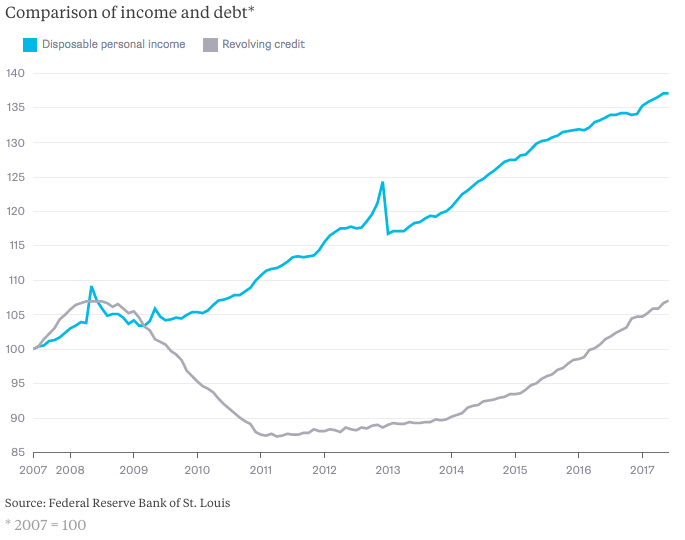
If that chart doesn’t convince you that this isn’t 2007-09 redux, consider the conditions of the consumer and housing market then versus today. Yes, it is important to have a cash cushion, but it’s more important to understand the total potential liability of personal debt. Many people failed to understand they were sitting on ticking time bombs of resetting mortgages, whose low teaser rates were going to eventually reset at much higher levels. A home mortgage that was affordable at the outset suddenly became impossible for borrowers to service relative to their incomes. Given how many securitized financial products were built on top of these mortgages, and derivatives built on top of them, the financial collapse was all but inevitable.
This bears little resemblance to today. The quality of borrowers is much higher; debt-to-income ratios are much lower; if anything, the banks have tightened too much, denying credit to borrowers who would meet traditional lending standards.
The simple ability of the average American to service their debt is nothing like it was a decade ago.
But as long as too many pundits and commentators are unwilling or unable to master the basics of economic context and simple math, we’re doomed to these predictable episodes of hand-wringing.
_____________________
1. In “Seeing a Debt Crisis That Isn’t Really There,” I suggested seeing household debt against a backdrop of inflation, economic growth, population increase, delinquencies, debt quality and debt service costs.
2. “Here’s a partial score: Notre Dame 6.” (YouTube, Salon)
Originally: The Imaginary Debt Crisis Is Here to Stay
