
Bank Financing: The Disappearance of Interbank Lending
Money and Banking, March 05, 2018
“The Panic of 2007-2008 was a run on the sale and repurchase market (the ‘repo’ market), which is a very large, short-term market that provides financing for a wide range of securitization activities and financial institutions.” Gary Gorton and Andrew Metrick, August 2009.
Retail bank runs are mostly a thing of the past. Every jurisdiction with a banking system has some form of deposit insurance, whether explicit or implicit. So, most customers can rest assured that they will be compensated even should their bank fail. But, while small and medium-sized depositors are extremely unlikely to feel the need to run, the same cannot be said for large short-term creditors (whose claims usually exceed the cap on deposit insurance). As we saw in the crisis a decade ago, when they are funded by short-term borrowing, not only are banks (and other intermediaries) vulnerable, the entire financial system becomes fragile.
This belated realization has motivated a large shift in the structure of bank funding since the crisis. Two complementary forces have been at work, one coming from within the institutions and the other from the authorities overseeing the system. This post highlights the biggest of these changes: the spectacular fall in uncollateralized interbank lending and the smaller, but still dramatic, decline in the use of repurchase agreements. The latter—also called repo—amounts to a short-term collateralized loan (for a primer on repo, see here).
We start with the following chart showing changes in banks’ liability structure. The red line plots the fraction of domestically chartered commercial bank assets funded by interbank loans. After having trended modestly lower in the decade to 2008, the level began to plummet. Today, the amount of interbank lending is minimal, accounting for less than 0.3% of total assets. During this same period, the fraction of bank assets funded by deposits (the black line) rebounded sharply. After hitting a low of 59% in mid-2008, deposits now fund more than 76% of bank assets. While not displayed on the chart, we also note that total commercial banking system assets increased by more than 40% in the past decade, so the level of deposits rose by more than 80%. (Meanwhile, the FDIC reports that the insured fraction of domestic deposits fell modestly, from 63% to 59%.)
Fraction of assets of domestically-chartered commercial banks funded by interbank loans and by deposits (Percent), 1990-2017
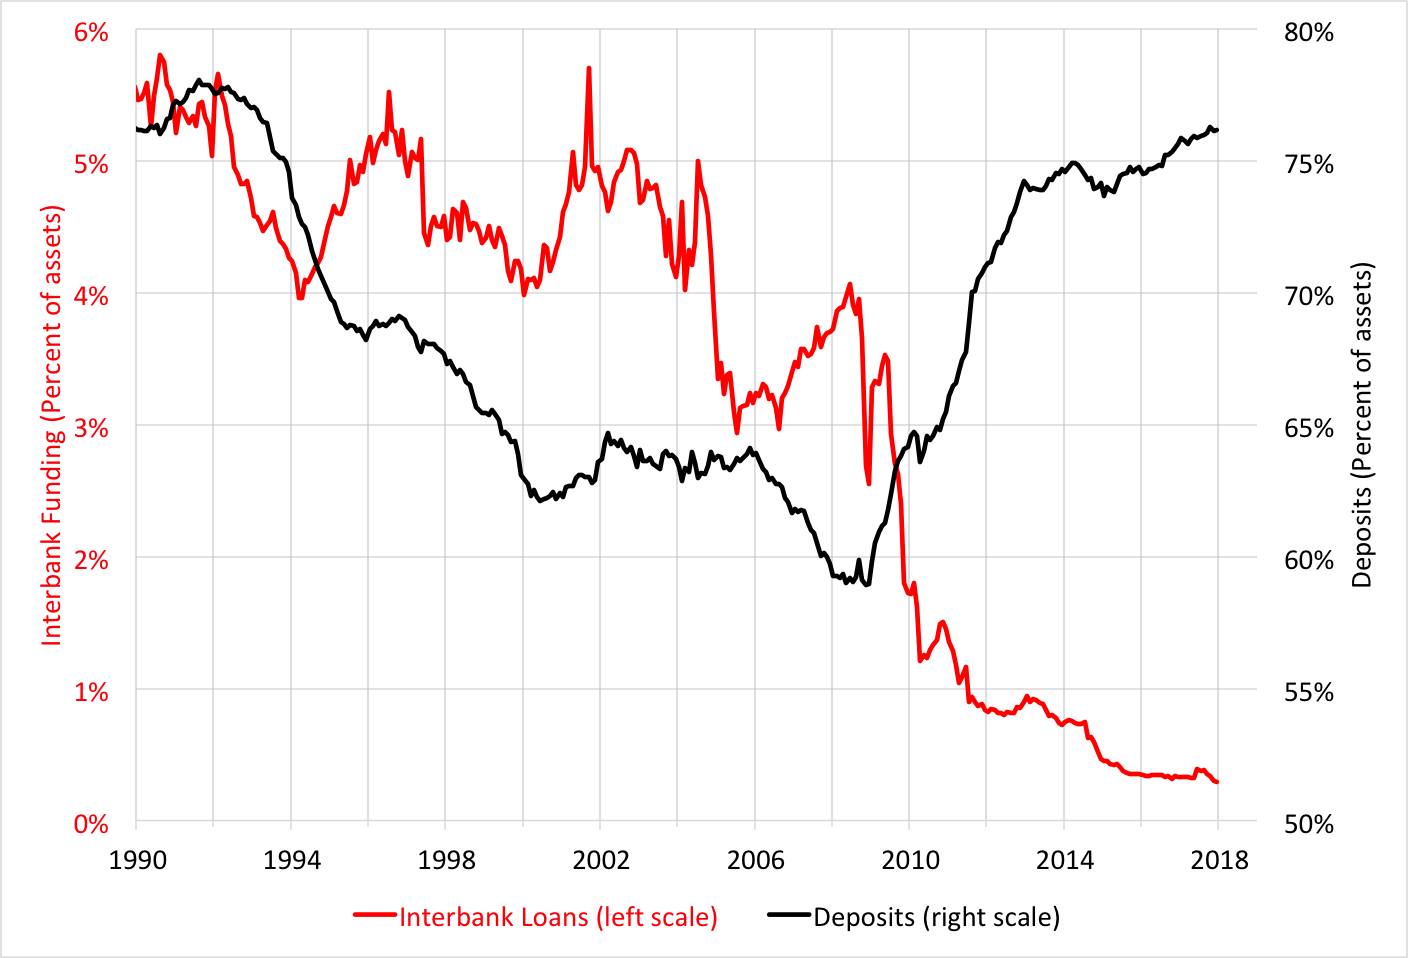
Source: Board of Governors of the Federal Reserve, H.8. Note that, as of the beginning of 2018, the Federal Reserve no longer reports interbank loans separately.
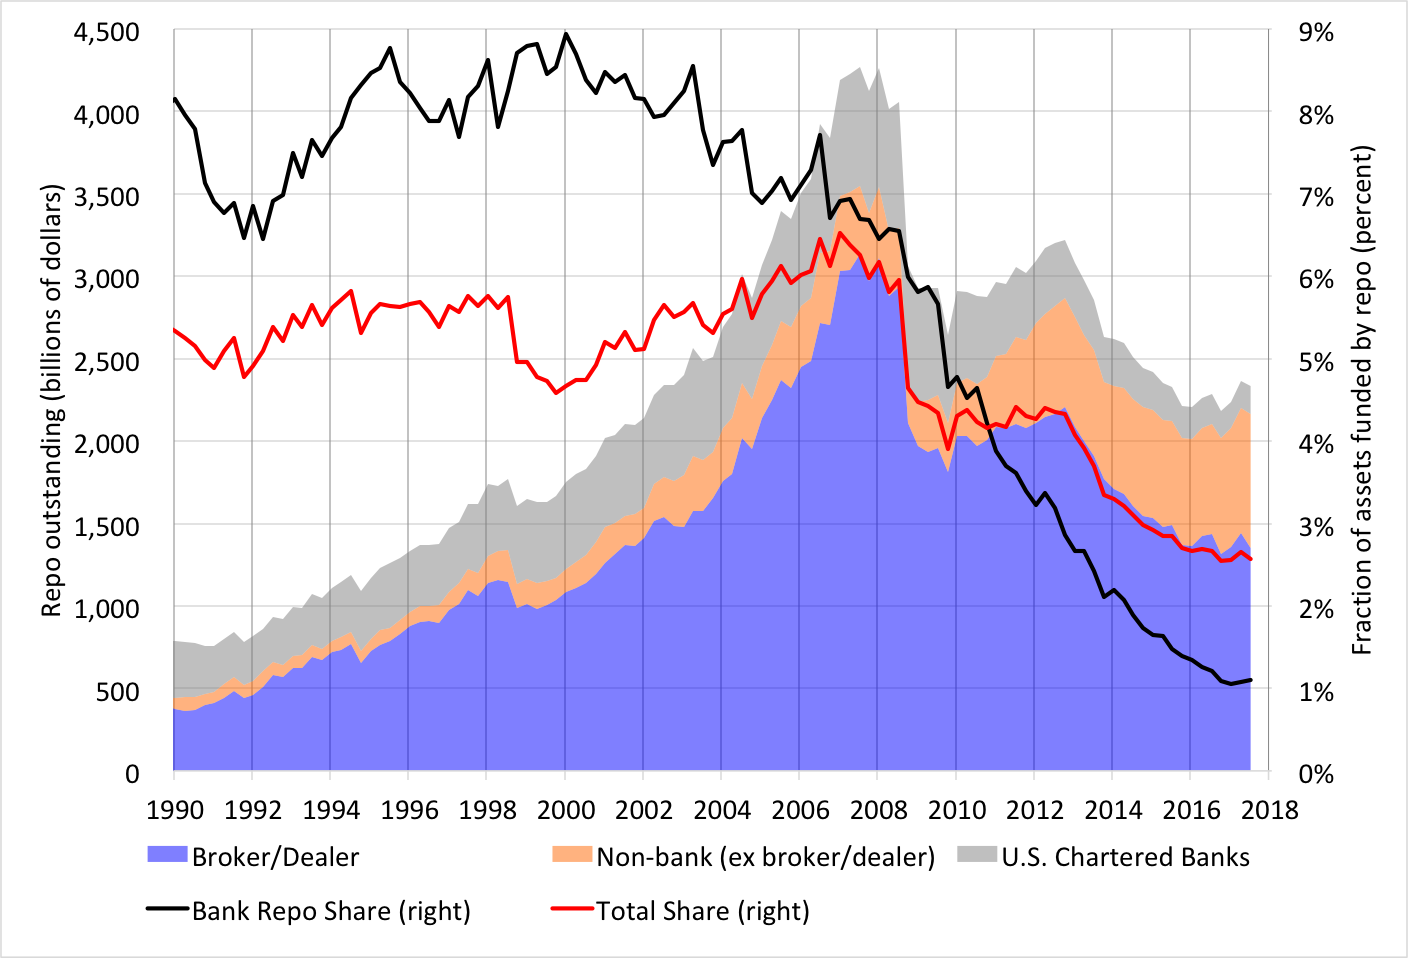
Not only has interbank funding virtually disappeared, but the extent of repo funding has declined as well. The following chart decomposes the use of repo as a funding vehicle by the type of private intermediary, including U.S. chartered banks (gray), securities dealers and brokers (blue), and the sum of other nonbank financial institutions and foreign bank branches (orange). After peaking at nearly $4.3 trillion in early 2008, aggregate repo funding by private financial firms has fallen to $2.3 trillion today. Furthermore, the fraction of U.S. chartered bank assets funded by repo (the black line) has tumbled from more than 6% in 2008 to about 1%. Adding the two pieces together, we see that from mid-2008 to the third quarter of 2017 the fraction of bank funding accounted for by the combination of interbank borrowing and repo has plunged from 10.5% to 1.4%.
Repurchase agreements by type of private intermediary: level (billions of dollars, left scale) and fraction of assets (percent, right scale), 1990-3Q 2017
To be sure, we have made some specific decisions in our choice of repo data, but we doubt that our choice affects the big-picture conclusion that private reliance on repo funding has declined substantially over the past decade. In addition to the Financial Accounts, which we employed, there are two alternative sources for information: the Federal Reserve Bank of New York and the Securities Industry and Financial Markets Association (SIFMA). For the period when all three are available, they all exhibit patterns similar to those in the chart. Furthermore, all three likely understate the size of the repo market: Copeland, Martin and Walker describe how the focus on primary dealers and tri-party repo results in significant underreporting. They go on to estimate that the overall repo market was fully 50 percent larger (or about $6 trillion) before the 2008 Lehman bankruptcy than we show here. But, since it arises from under-reporting of repo collateralized by securities other than a narrow class of high-quality liquid assets and of bilateral repo between counterparties other than primary dealers, we suspect that this understatement has waned over time. (Authorities should act expeditiously to fill these and other gaps in data on securitized financing.)
What accounts for the decline in reliance on these key forms of short-term funding? First, as we noted in our discussion of the decline in LIBOR, banks are much less willing to lend to one another on an unsecured basis. Having awakened to the true scale of counterparty risks during the crisis—especially from large, complex, opaque intermediaries—they simply view it as too risky.
Second, changes in capital and liquidity requirements appear to be playing a key role. Not only are capital charges more comprehensive and higher under Basel III (see here), but the liquidity coverage ratio (LCR) makes short-term interbank lending very costly. Specifically, the LCR specifies that, when a bank issues an unsecured wholesale liability of 30 days or less, it must hold between 25 and 100 percent of the amount in the form of either central bank reserves or sovereigns. Furthermore, since retail deposits tend to be sticky, the design of the LCR encourages their use as a primary funding source.
Together, these changes in internal risk management practice and regulatory structure almost surely account for the fact that interbank lending has disappeared while deposits now account for more than 70% of total funding. (In 2016, even Goldman Sachs got into the act when it started GS Bank USA.)
As for the fall in repo funding, two things have changed. First, it is part of a broader decline in what Gorton and Metrick refer to as securitized banking. This includes things like special-purpose vehicles (SPVs) created by banks to take assets off their balance sheet and fund them using asset-backed commercial paper (ABCP). Not only has the ABCP market virtually disappeared, but bank supervisors now require banks to consolidate SPVs and comparable entities onto their balance sheet. Second, since capital requirements are now much more stringent both in their definition of what constitutes capital and in their coverage of risky assets, banks face higher costs for expanding their balance sheet. Because the addition of a repo-funded asset increases the overall size of the bank’s balance sheet, it raises the probability that the simple unweighted leverage ratio requirement will bind, if it does not already do so.
Finally, as a recent report from the Committee on the Global Financial System (CGFS) describes in detail, central bank monetary policies have a clear impact on the volume of repo. First, the abundance of excess reserves reduces banks’ need to seek liquidity through repo. Second, large-scale asset purchases have reduced the volume of high-quality collateral available (as one example, less than one-tenth of German government bonds now float privately). And third, the relatively flat yield curve that these policies intentionally produce makes it less profitable for banks to use short-term borrowing to finance long-term assets.
All of this leads us to conclude that the changes in the regulatory system have improved the resilience of the system in material ways. Not only is capital higher, but liabilities appear less runnable. While securities dealers and brokers still fund nearly half of their assets using short-term secured borrowing, commercial bank funding appears to be much more stable than it was a decade ago, reducing the risk of contagion.
Have we gone too far in penalizing short-term funding? Are banks now failing to provide sufficient credit to the real economy? We strongly doubt it. First, overall lending continues to grow. Bank credit today is nearly 50% higher than at the end of 2007. Second, banks remain profitable. In 2017, the average return on equity ROE) for the largest banks (with assets in excess of $250 billion) was 8.5%. The higher pre-crisis ROE (in the mid-teens) for these behemoths in part reflected the funding subsidy they obtained from implicit government guarantees. Third, by boosting banks’ perceived resilience, the shift to longer-term, more stable funding also may have supported their equity market valuations. As of the latest FDIC global capital index in mid-2017, the price-to-book ratio for the largest U.S. banks (the 8 designated as global systemically important banks, or G-SIBs) averaged 1.28, up by 50% since the end of 2012.
The bottom line: Reducing the reliance on volatile short-term funding—without undermining the supply of credit—is an intended consequence of post-crisis regulatory reforms. While no one could be sure banks would react this way, they did (as did some de facto banks). Going forward, changes in regulation could surely alter this outcome, but for now, we seem to be on the right track.
