
Source: Torsten Sløk, Deutsche Bank Securities
What does the 2 – 10 yield curve inversion actually mean?
There are 3 potential answers:
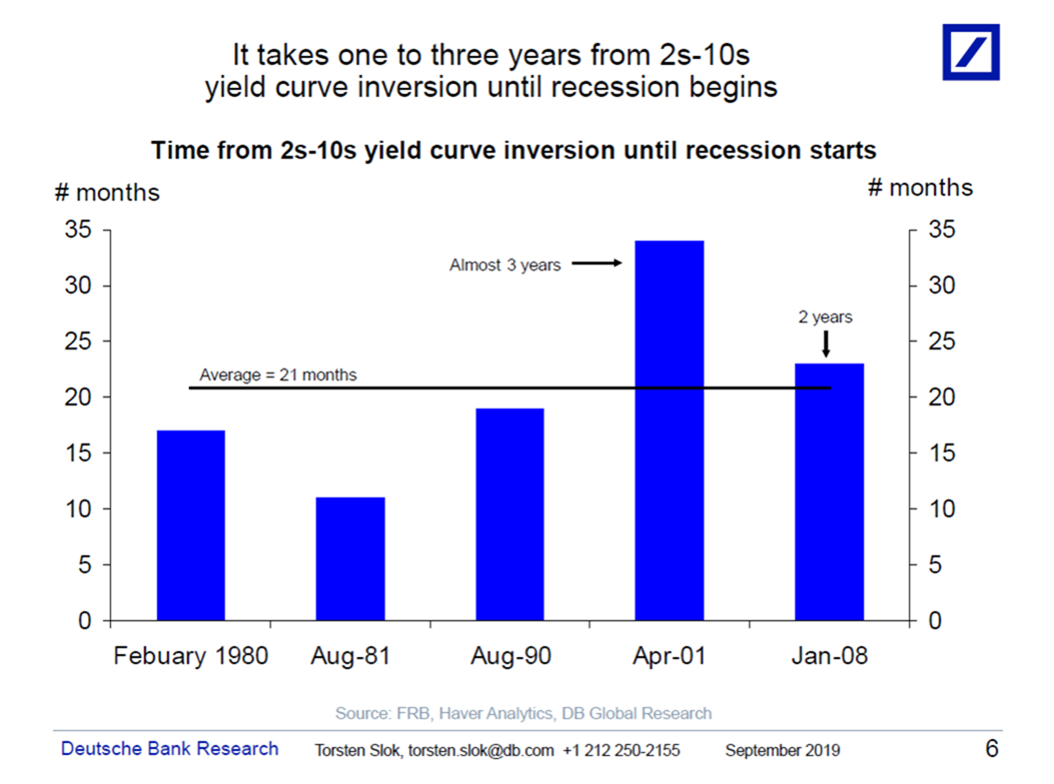
1. A Recession is coming in 12-24 months;
2. The Fed is too tight, and needs to cut rates;
3. Investors are rotating out of risk assets and into safe US Treasuries bonds;
Or some combination of any of the above.
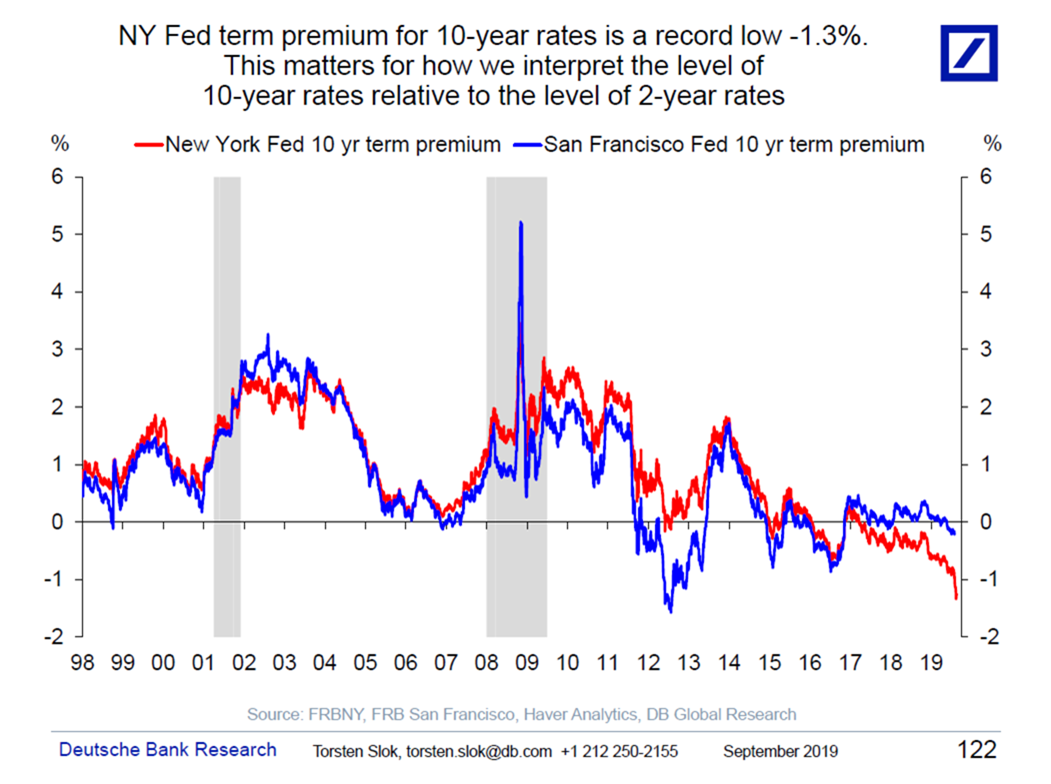
The chart above is from Torsten Sløk (MIB here), who observes:
“According to the New York Fed, the term premium for US 10-year rates is currently -1.3%. In plain English, this means that 1.3 percentage points of the decline in 10-year rates cannot be explained by Fed expectations or changed expectations to the economic outlook. With this backdrop, it is difficult to interpret the 2s-10s yield curve inversion as a recession signal because, as the first chart shows, most of the recent decline in 10-year rates is not because of the market changing its view on the economic outlook or what the Fed will do. Even if the 2s-10s yield curve inversion is a recession signal, it is not clear when we will have a recession.
Previously:
This Is Not A Drill (June 21, 2019)
Source: Torsten Sløk, Deutsche Bank Securities
