
Police Accountability Tool
click for updated map
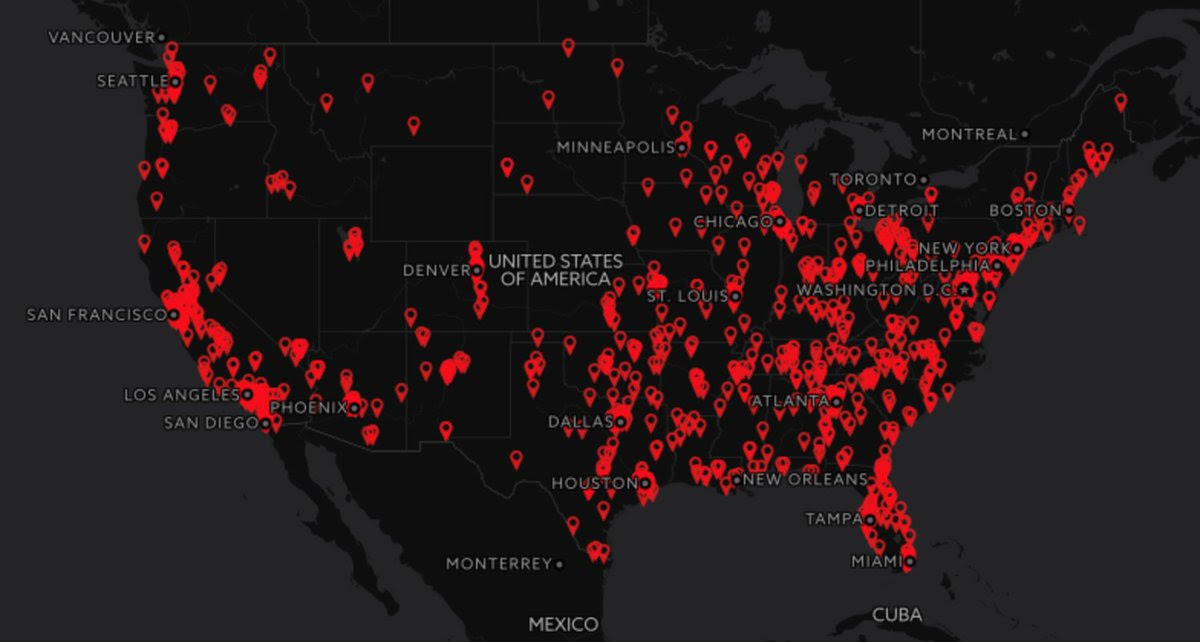
Source: Mapping Police Violence
Rates of police killings were calculated using the 2010 US Census population data by race and crime data from the 2013-18 FBI Uniform Crime Reports. Police departments included in this analysis reflect the police forces of the 100 largest U.S. cities.
Key Findings of the analysis:
- 26% of U.S. police killings between January 2013 – December 2019 were committed by police departments of the 100 largest U.S. cities.
- Black people were 38% of people killed by these police departments despite being only 21% of the population in their jurisdictions.
- Only 1 of the 100 largest city police departments did not kill anyone from Jan 2013 – Dec 2019 (Irvine, CA).
- 47% of unarmed people killed by the 100 largest city police departments were black. These police departments killed unarmed black people at a rate 4 times higher than unarmed white people.
- Rates of violent crime in cities did not make it any more or less likely for police departments to kill people.
- From 2013-2019, St. Louis Metropolitan Police Department killed 34 black men and Oklahoma City Police Department killed 25 black men. This is an average rate of 7.0 per 100,000 black male population in St. Louis and 8.5 per 100,000 black male population in Oklahoma City – a higher rate than the 2018 US Murder Rate of 5.0 per 100,000.
Astonishing…
