Interesting conversation yesterday about the economic “Recovery.” The people involved could not have been more different in their assessments and appeared to me to be projecting their own subjective, personal experiences.
It was a good reminder to always put data into broader national context so as to avoid the classic local/anecdotal trap.
Looking at absolute performance while ignoring relative numbers is a recipe for being misinformed. By most measures, we are still in a very deep recession. Many of the economic indicators I track remain “off the charts.” They are improving, with 3 specific data points making new highs, while most of the rest of the data I track remain far below their pre-lockdown peaks.
Here is some context that explains why this economy is not yet recovered from the effects of the pandemic and lockdown.
• Unemployment Rate: U-3 unemployment was only 3.5% in February 2020, and it skyrocketed to peak at 14.9% in April — and that likely undercounted full unemployment. It is 10.2% as of July 2020, a big improvement, but far above the recent lows. Not only that, as a reminder, the worst the Unemployment Rate ever got during the GFC was 10% in October 2009.
• GDP: Real GDP bottomed in Q4 2008 at -2.16% (annualized); today its -9.49% (annualized); if you prefer to use nominal GDP, that bottomed in Q4 2008 at -1.86% annualized, today it is -10% (-9.986%).
• Non-Farm payroll workers: There were 152.463 million people employed in February 2020; That fell to a low 130.303 million in April; it has since recovered to 139.582 million. There are 12.88 million people who have lost their jobs since the pandemic spread and have still not found new ones since the recession began.
Look back at the GFC: Peak to trough, the total job loss in 2007-10 was 8.7 million. There are 48% more people unemployed right now than at the peak of the GFC.
• Existing Home Sales: The Existing Home Sales (Seasonally Adjusted Annual Rate) were at 5.76 million in January 2020; they bottomed in May 2020 at a (SAAR) of 3.91 million, have since recovered to 4.72 million in June 2020. The current annual rate is still 18.1% below where it was to begin the year.
Its not all grim; some of the data is showing strong recoveries (with an asterisk):
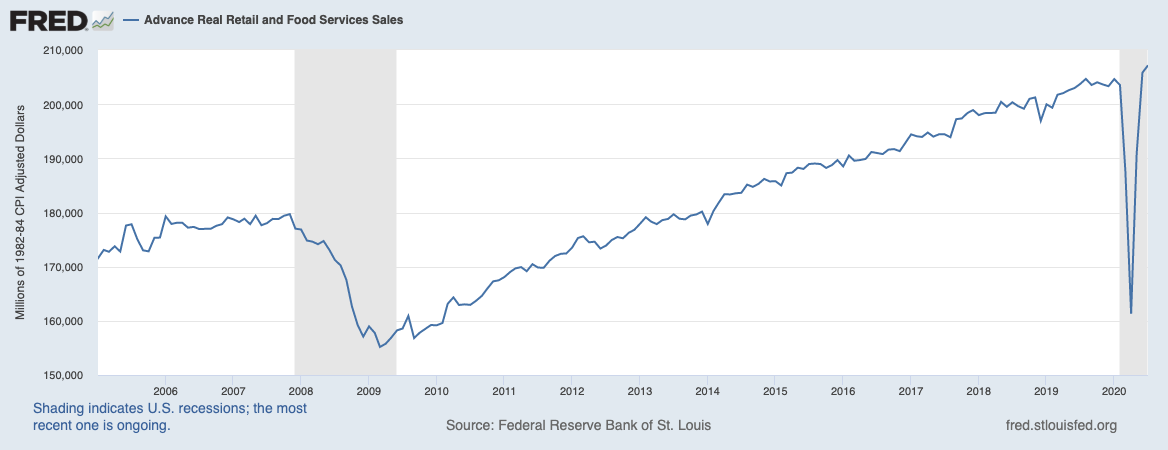
• Retail Sales: One of the few bright spots in the economic data: Advance Real Retail and Food Services Sales is now higher than it was pre-lockdown. It was $204.63 billion in January 2020; it hit $207.16 billion in July 2020. Economists credit extended unemployment benefits, $1,200 stimulus checks, and $600 stepped up unemployment for the increase.
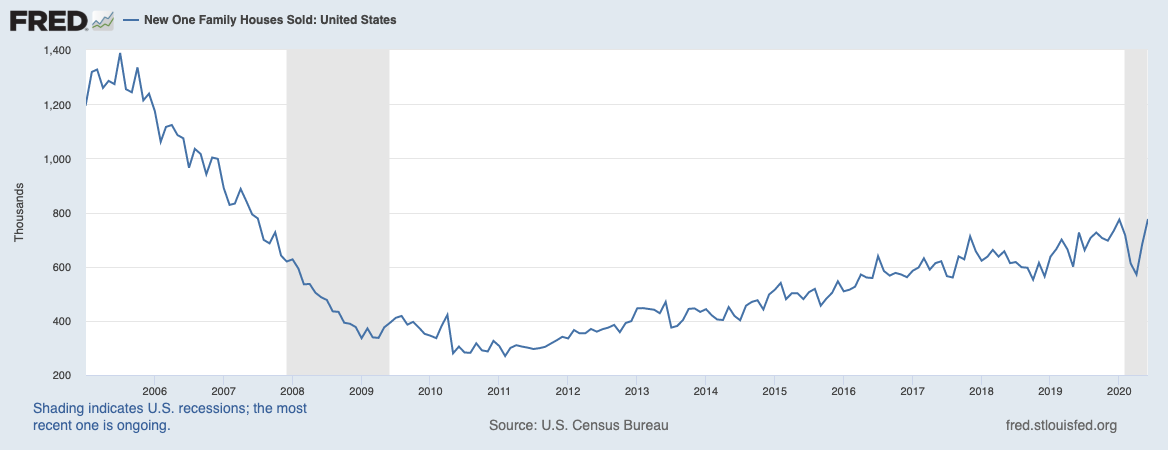
• New Home Sales: They account for only about 16% of all home sales, but New Home Sales are back above their earlier highs. In January 2020 they were being sold at a () of 774,000; In April 2020 that fell to 571,000. June just edged out January out with a recovery to 776,000 new homes sold.
Note: We are still far off of the New Hime Sale peak in in July 2005 at 1.39 million.
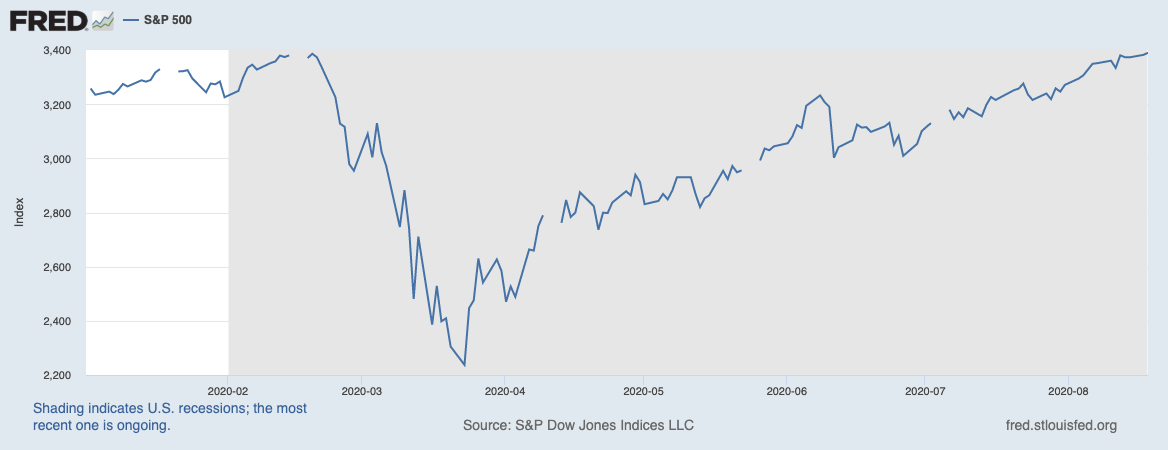
• Stocks: This was the fastest move down in both the markets and the economy and not surprisingly, the fastest snapback in the stock market. On February 18, the S&P500 made a new high at 3386; today it is also at a new high at 3395. Stocks are now at new all time highs, which according to my philosophy, is bullish for further market gains.
By most economic measures, we are still worse than we were at the very nadir of the Great Financial Crisis in 2008-09.
Retail Sales above prior highs
New Home Sales above 2020 peak
S&P 500