We talked a bit about the magazine cover indicator Wednesday night. I don’t think Ken Heebner on the cover of Fortune is not a great example.
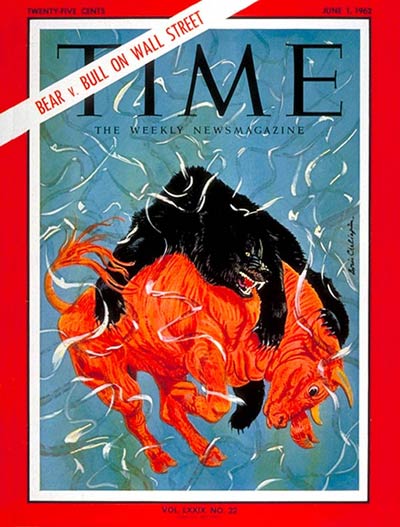
How is this June 1, 1962 Time Magazine issue? Perhaps this is a more significant example of the Magazine cover indicator?
That cover, showing a Bear mauling a Bull, took place when stocks were getting whacked.
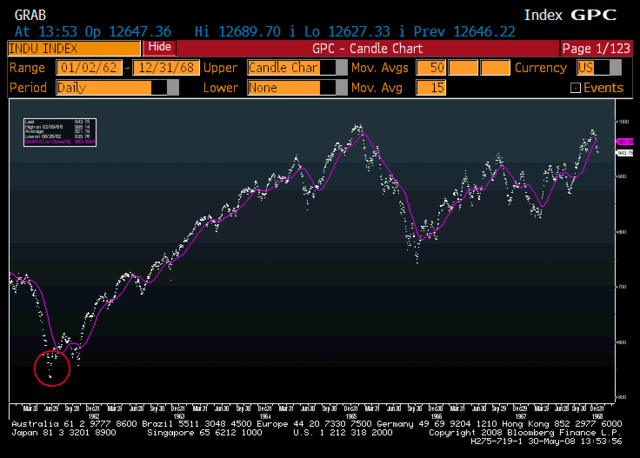
As you can see from the chart below, this obviously Bearish cover worked well as a contrary indicator — it was not a bad entry point to get long equities:
>
Dow Industrials 1962 – 1968
click for larger chart


I completely agree w/the premise of the magazine indicator….but to be picky and for the record:
DJIA = 611 @ 6/1/62, 622 @ 5/24/62
DJIA bottom = 536 @ 6/25/1962
DJIA 62 close = 652
Well, there’s your problem. That’s a puma attacking the bull.
Isn’t the contrarian magazine cover indicator just a representation of conventional wisdom lag? Magazines like to seem edgy but in reality they market a product to reinforce existing memes.
Will you get off this magazine cover thing for once?
It’s so obvious that things get reported AFTER they happen (ie. bear markets) rather than BEFORE. And after a bear market is likely to come a bull market. So a bear market happens, a magazine reports it, and reasonably often a bull follows sometime thereafter. Duh.
Unless you can demonstrate that statistically all magazine covers that discuss bear/bull markets (not just your cherry-picked covers) occur at statistically meaningful inflection points of relevant magnitude, you’ve got nothing here but the ridiculously obvious.
So please, get over it!
(Love the blog otherwise)
Gotta agree with RN on this one. You’re obsessed with this, and it’s silly.
On December 4, 2004 the Economist ran with the cover “The Disappearing Dollar”.
You gonna tell me we’ve had a dollar bull market since then?
There is both a science AND an art to selecting which of the various covers in which mags will work as contrary indicators. I doubt a study will reveal anything.
Click thru many of the mag covers I discussed in the past. LOTS of these have been great, real time, money making indicators.
Nothing ininvesting is a sure thing — but read properly by a skillful observer, there is value in magazine covers
“There is both a science AND an art to selecting which of the various covers in which mags will work as contrary indicators. I doubt a study will reveal anything.”
If there is both a science and an art, then really, there is only an art, and it’s likely a “mystic one” like astrology.
By the way, what’s the technical analysis on all the white stuff floating around in this particular cover? Shredded ticker tape? The bloodless entrails of the over-leveraged? Or do we need to scan it, inverse the blue channel, fold it in half three times, spit on it and wait 15 minutes before a secret message is revealed? Come on, tell us!
Come on, don’t pile up on BR. Look at the top of the page, there is “markets” box on the left and “digital media” on the left…He is into both, and I can’t think of a better intersection of markets and media than “contrary indicator”… do I agree with RN, mario and others? sure I do
I bet you will see that the snowfall drops in any city after snow-related news takes the most space on the front page of the local paper.
Well, this is exactly why the cover was inappropriate:
1962 was the year of the Tiger.
Economist also had an article calling for $5/bbl oil when oil was at $10/bbl. That nailed the bottom almost perfectly.
Yeah, smoofy and I both recall that one… Fall, 1999 issue of Economist with the cover story “A world awash in oil.”
Also, don’t forget the February, 2007 cover. “It’s a low, low, low rate world,” discussing the easy availability of credit.
I certainly watch magazine covers and CNBC specials as contraindicators. There’s no reason to ignore those data points.
Another great magazine cover call was LIFE magazine, during the week of 26 May 1970 (the exact low of a deep bear market). A multi-page article bemoaning the collapse of the economy in general — and homebuilding in particular — actually had marching, growling bears depicted in red ink along the top and bottom margins of the pages.
The magazine cover indicator works, because the Media tells people what they want to hear, by magnifying their own thoughts. At the bottom of a bear market, they want to hear gloom & doom. At the top of a Bubble, they want to hear more blue skies (as in “Why We’re Gaga Over Houses,” Aug. 2005).
Those denouncing the magazine cover indicator probably aren’t traders. ALL information has some relevance. Fading magazine covers is one of the rare occasions when you can let the Media do your thinking for you (although in inverted fashion).
For a recent example, just recall the 24/7 heavy breathing over crude prices on CNBC, the week before this one. Marked a short-term top, didn’t it?
The best, imho, is the Economist. Check out these recent gems:
March 22 – basically calling the bottom (or near the bottom):
http://www.economist.com/printedition/displayCover.cfm?url=/images/20080322/20080322issuecovUS400.jpg
March 1 – talking about the trouble in Russia
http://www.economist.com/printedition/displayCover.cfm?url=/images/20080301/20080301issuecovUS400.jpg
Performance since the cover (via ETF proxy):
http://finance.google.com/finance?q=NYSE%3ARSX
Now, are these a scientific measure – of course not – but I used the first one to get long and it has worked fairly perfectly as a confirmation signal.
This is an obvious case of the Silent Evidence fallacy (see The Black Swan, Nassim Taleb). How about tracking all the other Time magazine covers to see whether they are contrary indicators?
Mich(^IXIC1881) wrote:
“I bet you will see that the snowfall drops in any city after snow-related news takes the most space on the front page of the local paper.”
Ok, that’s very funny writing.
Not to mention exactly on point.