 Over the past few years, we have railed at the prettyfied numbers that come out of BLS regarding NFP job creation and the unemployment rate. From the Birth Death Adjustment to the understated unemployment rate, the official data (and corresponding headlines) painted a very misleading picture of what was going on. No conspiracy, mind you — just a creeping bias that has slowly distorted the data.
Hence, the past few years of aberrational, credit-driven economic growth was hidden from the public view. Many (tho not all) of Wall Street Economists were too hapless or cowardly to point this out. And some even cheerleaded the absurdity of the “Goldilocks” BLS data. Some simply declared the US a Nation of Whiners.
With the economy now in a full blown recession, and the Housing and Credit crisis getting worse, it hardly semed necessary to pile on BLS. Until Friday’s report. As bad as it was, looking beneath the headline data hows that it was worse — much worse — than reported. Consider the following:
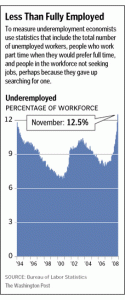
Unemployment: U6 (Table A-12, Alternative measures of labor underutilization), the broadest measure of unemployment, jumped to 12.5%. This is the highest reading since the U6 measure was created 1994. Note that our A Modest Proposal regarding reporting both U3 and U6 was followed by the NYTimes last week.
Labor Pool: 637,000 left the labor force last month, typically because they could not find work. The shrinking labor pool has made the unemployment rate appear better than it really is. 7.5-8% is a slam dunk next quarter, and if things get even a little worse, we could see even 9.5-10% unemployment rate before the recession ends (Remember, Unemployment is a lagging indicator). The NYT reported:
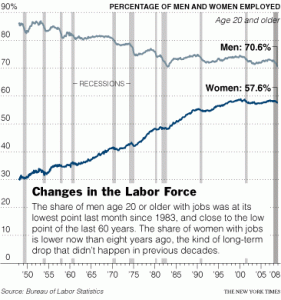
“The number of people out of the labor force — meaning that they were neither working nor looking for work and that the government did not consider them unemployed — jumped by 637,000 last month, the Labor Department said. The number of part-time workers who said they wanted full-time work — all counted as fully employed — rose by an additional 621,000.
Already, the share of men older than 20 with jobs was at its lowest point last month since 1983, and very close to the low point of the last 60 years. The share of women with jobs is lower than it was eight years ago, which never happened in previous decades.”
Companies Adding Jobs: For this data, turn to diffusion index (Table B-7, Diffusion indexes of employment change). These figures are the percent of industries with employment increasing; It crashed from 37.8 to 27.6.(50% percent is the midpoint, indicating an even balance between hiring and firing).
Seasonal adjustments: To answer the SA question, we turn to John Williams of Shadow Government Statistics. John notes that the headline 533,000 jobs loss — net of concurrent seasonal adjustment bias — would have shown a monthly jobs loss of 873,000. Over the course of the past year, SGS suggests that job loss number was actually understated by 955,000.
 Underemployment: Lastly, Bill King points us to the this article in the Washington Post, Rising Underemployment Contributes to Pain of Jobs Slump:
“The government does not count some types of underemployed workers — those who are overqualified for their current work, for instance. But it does count people who are working part time when they would prefer full time. That count has jumped by 2.8 million in the past 12 months, to 7.3 million.
There are people in a worse position. In all, 10.3 million were reported unemployed in November, sending the nation’s unemployment rate to 6.7 percent, the highest level in 15 years.”
Underemployment measures provide a more accurate measure of what the economy is like for labor.
>
Previously:
Unemployment Reporting: A Modest Proposal (U3 + U6) (June 2008)
http://www.ritholtz.com/blog/2008/06/unemployment-reporting-a-modest-proposal-u3-u6/
Pervasive Pollyannas of Prosperity (July 2008)
http://www.ritholtz.com/blog/2008/07/pervasive-pollyannas-of-prosperity/
Sources:
Table A-12, Alternative measures of labor underutilization
http://www.bls.gov/news.release/empsit.t12.htm
Table B-7, Diffusion indexes of employment change
http://www.bls.gov/news.release/empsit.t20.htm
Grim Job Report Not Showing Full Picture
DAVID LEONHARDT and CATHERINE RAMPELL
NYT, December 5, 2008
http://www.nytimes.com/2008/12/06/business/economy/06idle.html
Rising Underemployment Contributes to Pain of Jobs Slump
Michael S. Rosenwald
Washington Post, December 6, 2008; Page D01
http://www.washingtonpost.com/wp-dyn/content/article/2008/12/05/AR2008120503293.html


What's been said:
Discussions found on the web: