“The Shadow Gold Price”
Paul Brodsky & Lee Quaintance run QB Partners, a private macro-oriented investment fund based in New York.”
~~~~
Conclusions:
Spot Gold is fundamentally cheap versus its intrinsic monetary value by a factor greater than 10
Stocks are empirically very cheap versus the current quantity of paper money bank reserves
Perspective
For a host of reasons (scarcity, fungibility, measurability, divisibility, transportability, storability, resiliency, desirability, and difficulty to counterfeit) gold and silver have been money for thousands of years. Though they had value in exchange, they were and remain cumbersome and risky to carry. The origin of banking, therefore, was one of safekeeping. Banks issued paper claim receipts to their customers against the deposited gold holdings that they kept in their vaults.
Eventually banks fell prey to temptation, reasoning they could get away with issuing more receipts than the gold they housed. Banking became a more profitable business as it devolved into a leveraged game of chicken – collecting a positive interest spread (interest paid to gold depositors vs. interest charged on loans) while avoiding the very low probability that substantially all gold claim holders would attempt to simultaneously exchange their receipts for the bullion in the bank’s vault.
The practice of issuing gold claims in amounts that exceeded actual holdings came to be known as fractional reserve banking (the number of gold receipts floating was only “fractionally reserved” by the amount of physical gold). Clearly, earning interest on receipts lent that exceeded the gold on deposit enhanced their profitability – and, as we see yet again today, greatly magnified the eventual vulnerability of bank balance sheets.
In 1913 disparate US banks became loosely joined by the reintroduction of a central bank – the Federal Reserve System. The Fed serves as the bank for US banks. Historically, the Fed’s balance sheet counted the peoples’ gold held in member banks as assets on its balance sheet, and counted the banks’ claims against that gold as liabilities. In 1934, the Roosevelt administration mandated that all private gold holdings be turned into the government in exchange for $20.67 per ounce (FDR subsequently devalued the dollar to $35 per ounce of gold). This gold then became official gold reserves – assets on the Fed’s balance sheet. In 1971, the US dollar went completely off the gold standard, meaning all paper dollar holders had no claim to the metal (still owned by the government).
Were the US to have a gold standard today, bank reserves held at the Fed would be strictly redeemable into gold. That is no longer the case under today’s fiat money standard. Today’s “reserves” are supplied to the banking community by the Federal Reserve System itself. In generic terms, these reserves are comprised of physical currency (Federal Reserve Notes and coins) in circulation and paper (or, more accurately, electronic) reserves held by private banks at the Fed. In sum, these two reserve components principally comprise Federal Reserve System liabilities.
As the liabilities of the Fed grow or contract, the reserves against which modern banks can lend grow or contract. A dollar of reserves can generally be leveraged into $10 of “checkbook money” (demand deposits) via the multiplier process (i.e., Fed regulations dictate that, in the aggregate, 10% of all loans made by a bank must be reserved at the Fed). So there are two variables at work here: 1) bank assets (gold then, paper now) and, 2) the percentage of bank assets that need to be held in reserve against a bank’s loan book.
Overlaying today’s fractional reserve system onto a hypothetical gold standard would imply that for every ounce of gold held in reserve by the Fed, the banking system could create (through lending) claims on an amount of up to 10 ounces. In the event that the lending system were to become fully lent out (leveraged), accumulation of incrementally more gold reserves by the banking system would be necessary so that incrementally more credit could then be leant into existence. Thus, the intrinsic scarcity of gold would act as a curb on reserve growth. (Sounds like kind of a good idea, eh?)
It is important to note here that a gold standard DOES NOT DIRECTLY impact the propensity of the banking system to leverage a given base of reserves. That discipline is either supplied by system regulators (currently the Fed, FDIC, etc.) or, in prior times, the depositor base itself (in the absence of FDIC-type of guarantees depositors would be much more prudent in analyzing the risk of a given depository institution before lending it their money).
Nevertheless, it is argued and seems logical that a gold standard WOULD INDIRECTLY constrain excessive voluntary bank leverage to the extent that banks would rightly perceive as finite a central bank’s status of lender of last resort. Where there is no possibility of subjective moral hazard there would be far less hazard. Be that as it may, under a fractional reserve banking system such as we have today, where the number of claims against a bank exceeds its reserves by a factor of 10, the notion of a bank run is easily understood and indeed, seems to be a black-swan type of inevitability.
The System Today
As today’s banking system reserves have no contractual convertibility into gold (or any other scarce good or resource), there are no formal constraints on their creation. This freedom (lack of embedded structural discipline) allows central banks to create reserves at will in order to counteract contractions in lending (should reserves and/or the multiplier contract).
The fractional reserve lending system of today (and, for the most part, of yesteryear) is a marriage of managed forces (the quantity of reserves and required reserve ratios) and of free-market forces (the propensity of private market agents to borrow and lend). Thus, the unpredictability of loan allocations and consumer demand that determine the magnitude of the multiplier effect ensure the banking system is not an entirely manageable process.
In times of stress, waning confidence of both potential lenders and borrowers causes the money multiplier to contract sharply (debt deflation). Under a gold standard, central banks would be left relatively powerless to stimulate the monetary/lending process, as they could not create gold “out of thin air”. This is no longer the case because the current fiat regime allows central banks to subjectively create “paper gold” (inflate the monetary base) to counteract deflationary forces. (Strict comparisons of the financial crisis today to the 1930s, therefore, are unwarranted).
We should note here, however, that speculative bubbles are not necessarily a direct result of paper reserve banking systems. Indeed, bubbles have also occurred with some frequency under various gold standards. Speculative bubbles are most typically a function of leverage, which takes its cue from aggressive lending practices (when uncollateralized paper loan claims dwarf the pool of reserves of the system). These conditions clearly characterized financial activity in the 1920s and, until recently, the global financial system of the last 10 to 12 years.
The ability of banks to issue claims far in excess of their reserve position is essentially regulated counterfeiting when those claims have little or no chance of being satisfied, and it is an inherently cyclical and destabilizing process. The Fed, as US banks’ chief regulator, has not only condoned this imprudent, unsustainable (and Constitutionally-dubious) activity, it has encouraged and abetted it. 3
There is no denial or shame among policymakers in pursuing and promoting this inflationary policy, as best evidenced through numerous academic papers and post-academic works by Fed Chairman Bernanke. Inflation is acceptable public policy and in a pinch there are no limits on it.
The Money Multiplier
Estimates of ultimate global wealth destruction (asset/debt deflation) resulting from the current credit crisis range anywhere from $10 to $30 trillion (supposedly $8.7 trillion so far). We, like you, have no idea what the ultimate magnitude of the paper losses will be and we strongly suspect that the Fed can’t pinpoint the eventual extent of paper losses either. Manifestly, the Fed is now in the business of guessing how many new bank reserves are needed to stabilize and resurrect asset collateral values and thus, the solvency of those it seeks to protect in the banking system.
The Fed will succeed because it has the power to effectively create infinite amounts of money and credit without any formal justification. Should the Fed conclude that the effectiveness of its sizable expansion of bank reserves to date will be muted by a stagnant or contracting money multiplier (i.e., it’s “pushing on a string”), it could turn to the next page in its playbook and monetize assets directly to prop up their prices. (It does this simply by purchasing US Treasury securities, MBS, corporate credit, etc. outright from primary dealers and electronic proceeds are created “out of thin air” and are credited to the dealers’ bank accounts.)
In effect, the Fed simply replaces destroyed checkbook money with newly minted reserves. (Again, this is right in Chairman Bernanke’s wheelhouse where he keeps a witches’ brew of money and credit creation tricks.) It looks and feels like a one-to-one dollar exchange when the multiplier is stuck at one. It is an exponentially inflationary process should the multiplier begin to expand (as it will).
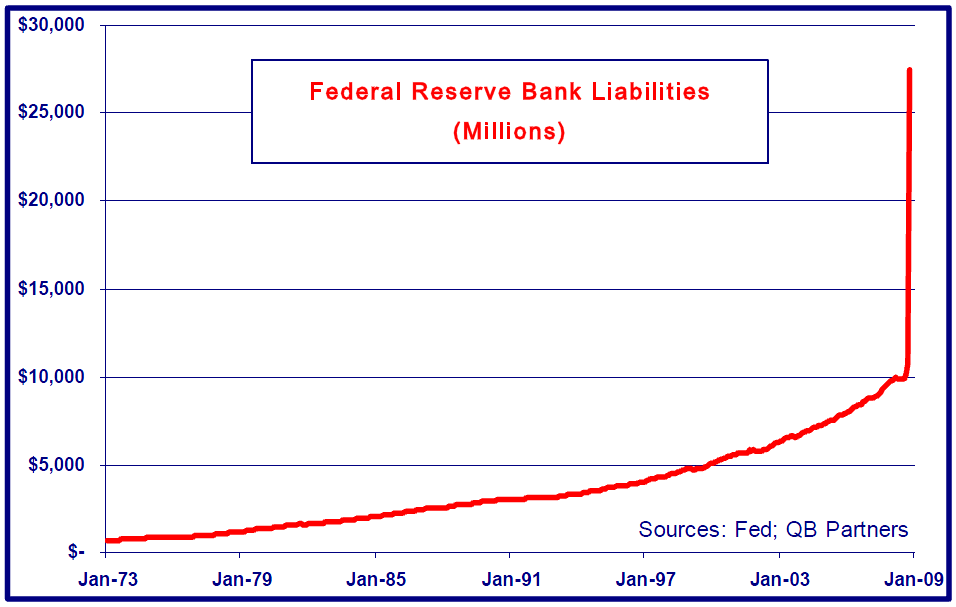
Federal Reserve Bank Liabilities (Millions)
Sources: Fed; QB Partners
Let’s apply this knowledge to current events. What everyone knows for sure is that the Fed has already increased its liabilities (bank reserves) from roughly $800 billion a few months ago to approximately $2.5 trillion today. (If we were on a gold standard, this would be the equivalent of the Fed tripling its gold reserve holdings.) And, of course, mainstream estimates are calling for further expansion in the near term.
Let’s assume the Fed is estimating there will be $20 trillion in wealth destruction when the dust settles and that it has decided to pursue the following policy objectives to counteract the deflationary impact of massive credit destruction (no doubt other central banks are working with the Fed to address these concerns as well). Its goals would be the following:
1) Restore nominal asset pricing to levels that support outstanding nominal debt claims (restore collateral values)
2) Create liquidity” to generate sufficient demand for these assets (in the aggregate – all “assets” are unlikely to return to their former peak pricing – some would exceed prior levels while others would fall short)
3) “Mop up” any excess liquidity once asset prices have generally appreciated back to levels at which aggregate debt levels are adequately supportable again (a tricky endeavor at best)
This would be a reasonable plan but, unfortunately, there would be a number of brain teasers left for the people at the Fed. Is $20 trillion the right number? If so, how does the Fed create the precise amount of “liquidity” to ensure a restoration of asset support without applying too much? Are they making it up as they go? By what processes does the new money and credit provide liquidity? How does the Fed know when it’s provided too much and/or when to begin “mopping it up”?
It would seem highly unlikely that the Fed could expect precise results from its actions. The better odds are that the Fed would over- or under-shoot and that its timing would not be accurate enough to smooth out economic turmoil.
What was conceptual to Chairman Bernanke at Princeton has become reality to the US economy. The Fed has already increased bank reserves by almost 300% – roughly $1.7 trillion. Though the money multiplier has been contracting greatly with waning confidence in asset prices (as banks and potential borrowers haven’t yet triggered its re-expansion), global monetary authorities are monetizing debt, creating expansive new credit lines and have embarked on “quantitative easing” programs (for which to be effective, Chairman Bernanke wrote in 2004, must be pursued forcefully).
Still, we don’t know when or to what degree the money multiplier will kick in. If the multiplier were to continue to trend towards 1x, as it threatens to do now as banks are reluctant to lend, only $1.7 trillion of liquidity will have been created. If the multiplier were to trend back towards its historical level of 10x, then up to $17 trillion of new liquidity is already latent within the system.
This is the ultimate game of chance. The longer the private sector doesn’t re-lever itself and the more money (FRB reserves) the Fed must create to keep the system solvent, the more dollars will have been created off which the multiplier effect will eventually be manifest.
The key question is this: Can the Fed risk erring to the low side of stimulation (overestimating the multiplier effect) over the next 6 to 12 months? We don’t think so. The Fed can only risk underestimating the multiplier for some time to come. The Fed MUST risk major inflation tomorrow in order to provide enough liquidity to the markets today to: 1) stem the fall in asset prices, 2) protect against the dreaded deflationary spiral that leads to sustained rising unemployment and nominal output contraction and, 3) promote output growth and asset price appreciation tomorrow.
(Are you getting the picture that a subjective monetary system – one that does not have far more restrictive reserve requirements and the structural discipline of a gold standard – creates or exacerbates financial and real economic volatility? And when you think about it a little longer, does it start to become clear that the economic volatility fostered by fractional reserve banking redistributes wealth away from productive workers and capitalists to the lenders that prevail following the system’s inevitable break? We humbly argue that true capitalism CANNOT be underpinned by a paper/fractional reserve lending system. If anything, the systemic benefits of such a bastardized capitalistic economic system are paradoxically hindered as the efficient flow of capital within the economy is distorted. Economically unjustified transfers of wealth prevail.)
Ours is not a brilliant insight. The monetary inflation (or hyperinflation) that the Fed is currently pursuing aggressively is popular public policy across the political spectrum. Due to the multiplier effect, it should push prices higher, including those of many financial assets. Substantial goods, service and asset inflation is already being built into the system – its manifestation is really just a matter of when, not if. Below, we go through a valuation methodology – grounded in history and logic – that quantifies this inflation and makes the case for higher nominal gold and equity prices.
The Shadow Gold Price
Since bank reserves held at the Fed in the 1920s were claims on gold (a good thing for dollar holders and savers, a bad thing for debtors), they placed limited administrative constraints on banks’ abilities to expand their loan portfolios (good for economic and financial stability, bad for bank income statements). Neither did the due diligence of depositors retard system-wide over-leveraging then. It was, after all, “The Roaring 20s”, symbolized by the economist Irving Fisher instructing anyone listening that asset prices had reached “a new permanently high plateau”. Then as now, liberal bank reserve requirements allowed huge expansions of leverage, which locked-in the ensuing bust.
And as we’ve also discussed, despite the compulsion to find similarities, highly inflationary fiat currency regimes today ensure that today’s outcome will be very different from then. As investors we’re interested in anticipating the performance of asset classes in both real and nominal terms over time in a highly inflationary environment, and the best place to start is with the most ubiquitous “asset” of all – the US dollar. (Whether the dollar is formally an asset is debatable, as it is neither a tangible asset nor a predefined claim on anything specific.)
Nevertheless, a wad of bills and coins in your pocket amounting to $20.67 in 1929 could have been exchanged for a one ounce gold coin. A few years later, FDR officially devalued the dollar by about 70% when he confiscated private gold holdings at that price and subsequently raised the price fix of gold to $35 per ounce. That gold price remained stationary (at least in principle) until 1971 when Charles de Gualle insisted on receiving Fort Knox gold in exchange for France’s paper dollar reserves. President Nixon reneged, and the Bretton Woods gold standard was officially replaced with the US dollar standard of today. The “floating” gold price ever since has moved progressively higher than $35 an ounce, reflecting the massive devaluation of the dollar against something real (scarce and thus costly to expand).
To identify the intrinsic value of the dollar today, we examine the corollary – the intrinsic value of gold in dollar terms, which we dub “The Shadow Gold Price” (SGP). To do so we assume that Federal Reserve Bank liabilities are again exchangeable into gold (recall, FRB reserves are bank assets – the stuff that used to have to be gold). As we discussed in “A Not-So Modest Proposal”, one would simply divide the dollar amount of current Fed liabilities by official gold holdings. This calculation, while simple, is intellectually honest and produces a breathtakingly large “equilibrium” gold price of approximately $9500 per ounce today ($2.5 trillion divided by US official gold holdings of 8100+ metric tons).
Egads! What has the Fed been up to since 1971? Since “you can’t fight the Fed” we’ll simply whisper that gold seems to be “worth” substantially more than the $800 an ounce or so it trades on the COMEX paper futures exchange. Is this just an academic exercise? We don’t think so. In the movie Trading Places, Bo Diddley’s pawnbroker character didn’t care what Louis’ watch was worth in Gstaad; “in Philadelphia,” he said, “it’s worth fifty-bucks.” And we care less about where gold is priced today in the futures pit than we care about its objectively true monetary equilibrium – the price to which it will likely gravitate over time.
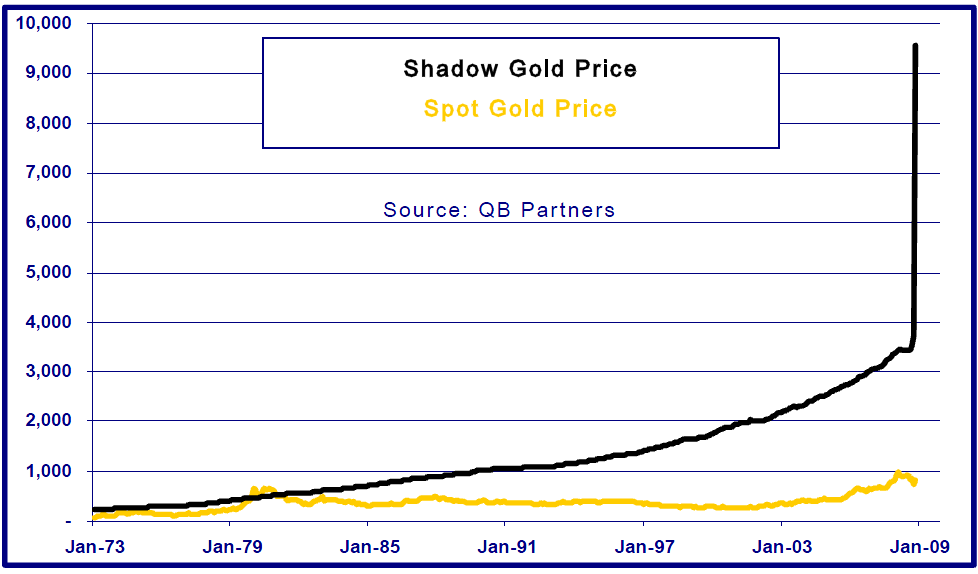
Shadow Gold Price Spot Gold Price
Our “Shadow Gold Price” (SGP) gives us the nexus of a valuation metric that seems legitimate and, hopefully, profitable. We gathered monthly data on a host of variables since 1973. The graph immediately above is a 35 year time series of the spot market gold price and the SGP. As you can see, spot gold and the SGP tracked each other fairly closely until the early 1980s. Interestingly, the SGP begins to take off in the mid-80s and has gone to the moon in the last couple of months. Of course this isn’t terribly surprising, given the muted variances in official gold holdings and the aggressive growth in FRB balance sheet liabilities over the same period.
If one allows for even a small probability of a future monetary system that reflects more honest/tangible money, then a quick glance at the graph above makes it easy to conclude that spot gold is fundamentally cheap. Even if this is too far a stretch for market participants skeptical of such a radical change in monetary policy, it is reasonable to conclude that the prices of spot gold and the SGP should converge somewhat over time.
Over the last six months, spot gold has dropped about 20% while the SGP has virtually tripled. At a minimum, this is a radical departure from historical relationships. When we last experienced a gold market frenzy (peaking in 1980), the spot market gold price traded at a sizable premium to the SGP (about 1.75 times when spot gold peaked above $800 per ounce). Today, spot market gold is trading less than 0.09 times the SGP. This is as cheap as it’s ever been by a large margin. To reach the frenzied peak today in terms equivalent to 1980, spot gold would need to trade above $16,000 per ounce. If the Fed doesn’t very quickly reverse the paper reserve growth of the last 20 years to bring the SGP back to Earth, then spot gold will inevitably blast off to the moon to join FRB reserves.
We doubt gold will trade at $16,000, but we’re not price anchored. Would you have imagined in 1971 that gold would rise from $35 to over $800 an ounce only nine years later? What is happening now is massive dollar devaluation and the graph on the previous page clearly depicts the magnitude of the story.
If the Shadow Gold Price, as an indicator of intrinsic value for spot gold (and therefore the recent diminution of absolute value of the dollar), has no basis in reality, then there can be no basis of value for anything denominated in dollars. You, we, our financial asset counterparties and policymakers can’t have it both ways. Either gold (the only historically reconcilable dollar value) finds something closer to equilibrium or else dollar-denominated capital markets have no meaning, and more importantly to most participants, will provide negative real returns.
Naturally, we dislike dollar-denominated long duration fixed income securities in all forms. Is that smart when Treasury yields are at all-time lows and the world seems to expect “deflation”? We’ll see. People were buying long bonds in the early 70s too, bless their altruistic hearts. We remember trading some of those bonds in the mid-eighties. They had absurdly tiny coupons and traded at such deep discounts to par that they were the object of ridicule. This is a variation on that same theme, we think.
Spot Gold & SGP to Stocks
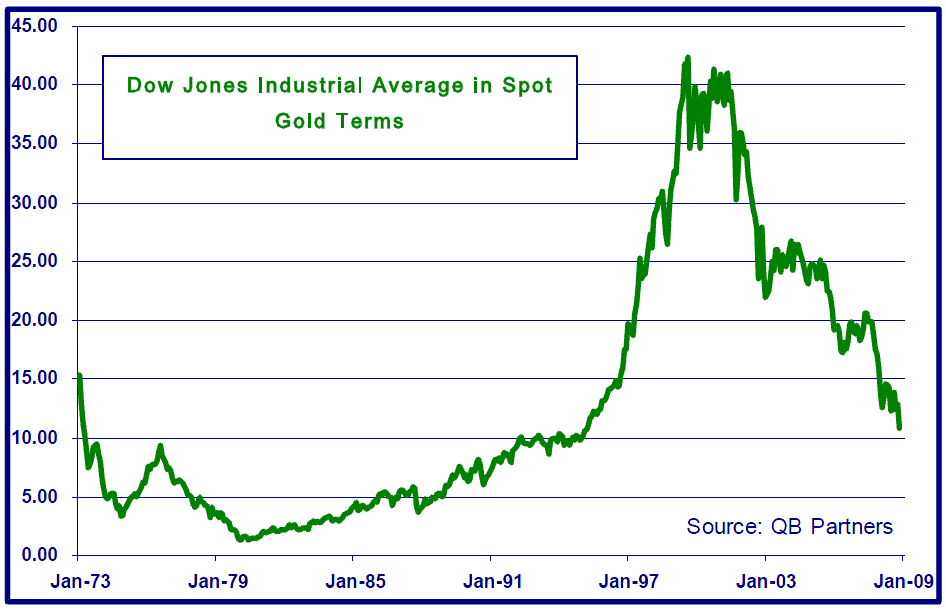
One of the more interesting relative value relationships over time has been the Dow Jones Industrial Average (INDU) measured in spot gold price terms. At the height of financial despair in 1980, this ratio sank to one (Gold spot price of $850 and INDU at 850). The ratio traded north of 40 at the peak of stock market mania in 2000.
Dow Jones Industrial Average in Spot Gold Terms
Source: QB Partners
Today, the ratio is trading around 10. By this metric alone, while stocks have given up much of their speculative froth so far this decade, they could unfortunately drop 80-90% further if the 1980 low is to be reached before this bear market concludes. (Keep in mind this analysis uses spot gold as the denominator of the ratio depicted in this time series.)
What if we were to use the Shadow Gold Price – the price we think reflects gold’s theoretical equilibrium level to US dollars, rather than the COMEX price – a notional price based on a miniscule percentage of actual deliveries of bullion? (Less than 1% of open interest in gold futures – which itself represents a small percentage of the global gold market – is actually settled in physical gold bullion. In this regard the COMEX paper price for gold is not entirely dissimilar theoretically to the former notional secondary market for sub-prime mortgages.)
Before taking a look at the next graph showing the more accurate comparison of the Dow Industrials to the SGP, we feel the need to reiterate that our SGP is simply a proxy for the size of paper bank reserves held today at the Fed, as it was in 1971, when it was the seed pile from which any and all credit growth emerged (via the multiplier). We think it is reasonable therefore to posit that growth in bank reserves can lead to growth in financial leverage which, further, can lead to speculative appreciation in nominal stock prices.
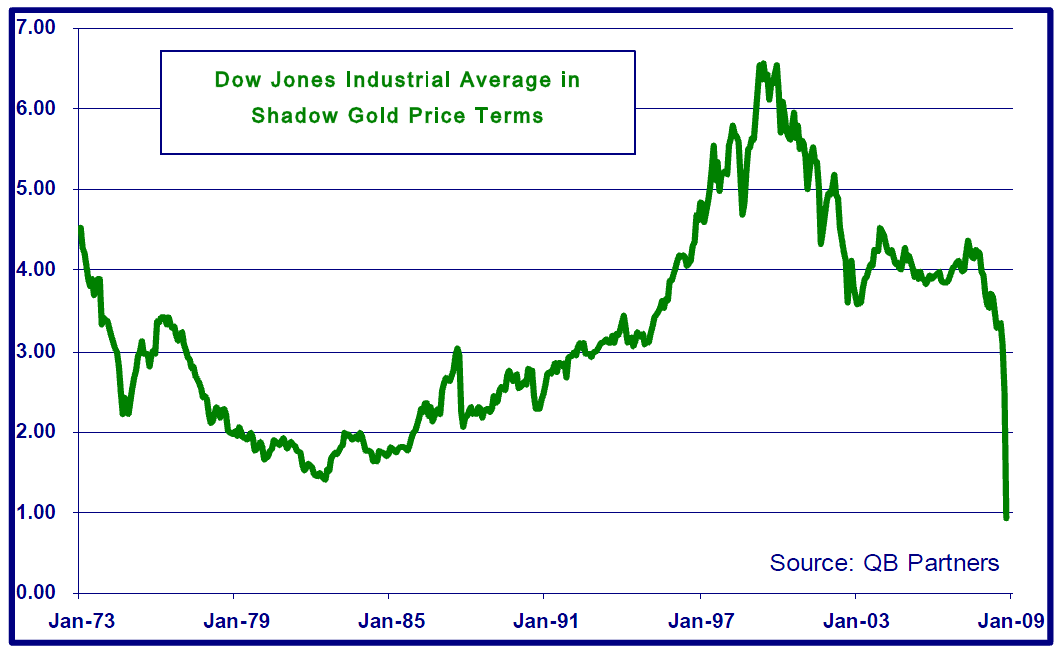
Dow Jones Industrial Average in Shadow Gold Price Terms
Source: QB Partners
The graph above is the humdinger. According to this valuation metric US stocks are cheaper than they were in 1982. Of course value relative to a different time is great for those who must be invested at all times. More importantly to us is the notion that equity prices seem extraordinarily cheap today versus “money”, given the recent growth in FRB liabilities. If one puts any stock (pardon the pun) in the notion that broad money supply growth is generally supportive of nominal equity prices over time, then this is undeniably compelling.
We believe the most accurate leading indicators of equity prices are: 1) the growth or contraction in system-wide money and credit and, 2) the velocity of change to the banking system’s multiplier effect. We know that reserve growth (and thus the fuel for rapid future credit growth) has just risen off the charts and that it now lays dormant for the markets – lenders, borrowers and investors – to tap into it.
Short term de-leveraging pressures no doubt prevail today but what about tomorrow? If one expects today’s reserve growth to lead (via the multiplier) to growth in systemic leverage (i.e., the broad monetary aggregates like M3 or their surrogates), one should be buying equities with both hands presently.
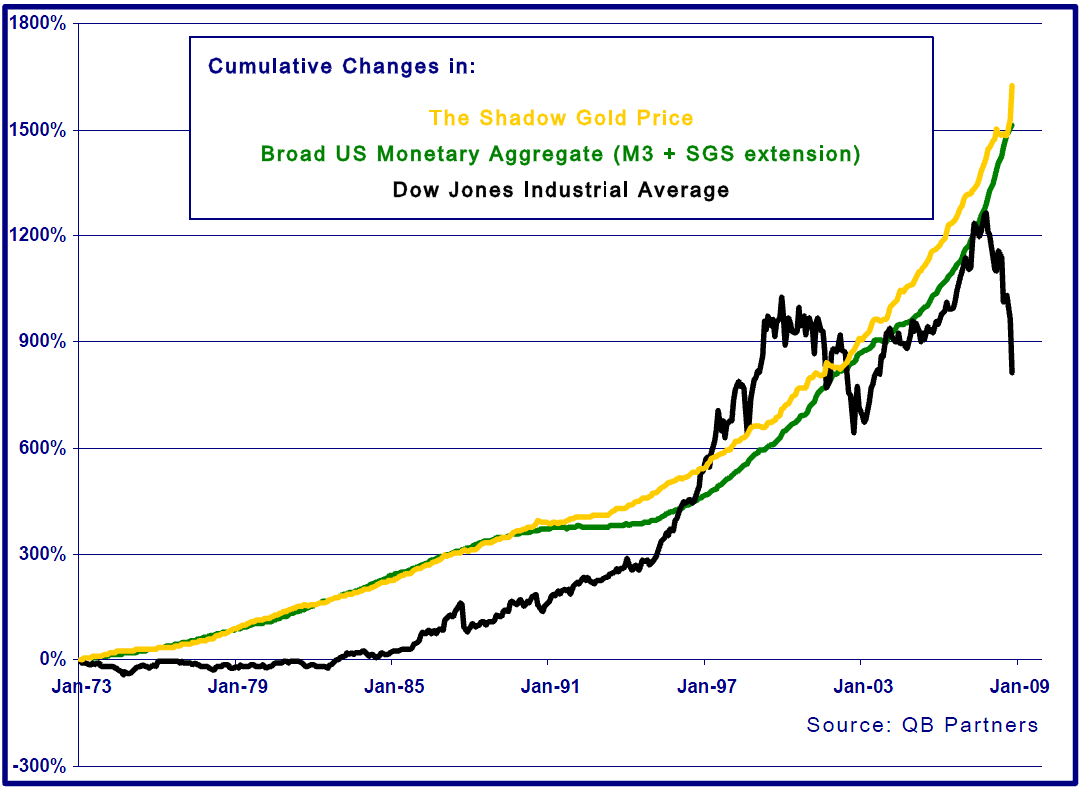
As one can see from the following graph, generally betting against the nominal price appreciation of equities while growth in the broad monetary aggregates ramps up has been a fool’s game. Should we expect it to be different this time? We don’t think so.
Cumulative Changes in The Shadow Gold Price Broad US Monetary Aggregate (M3 + SGS extension)
Source: QB Partners
One might infer from the graph above that equity prices were indeed cheap in January 1973 and remained so until late 1996. From that point until somewhere in 2002, stocks became extended (peaking in 2000). They became cheap once again in early 2003, which then preceded their recovery to new nominal highs in 2007. Stocks seemed empirically fair-valued in 2007, relative to gold and to money and credit growth. They’ve clearly dropped like a stone since and appear to be cheaper today than at any point in the last 35 years.
While this piece focuses primarily on gold and the US equity market, we suspect similar analyses applied to other domiciles and asset markets would produce similar conclusions. Equity and commodity markets are probably cheap across the globe in nominal terms, as most central banks are inflating their currency reserve bases to keep up with the Fed. We must also conclude presently that there is extraordinary risk in holding paper money and, for real money accounts, long term bonds.
Best,
Lee & Paul
Paul Brodsky
pbrodsky-at-qbamco.com
Lee Quaintance
lquaint-at-qbamco.com
November 2008
~~~~~~~
THIS MATERIAL IS NOT AN OFFER TO SELL OR A SOLICITATION OF AN OFFER TO PURCHASE SECURITIES OF ANY KIND. RETURN FIGURES HEREIN ARE ESTIMATED NET OF ALL FEES AND CHARGES. PAST PERFORMANCE MAY NOT BE INDICATIVE OF FUTURE RESULTS. ANY COMPARISONS HAVE BEEN OBTAINED FROM RECOGNIZED SERVICES OR OTHER SOURCES BELIEVED TO BE RELIABLE. THIS REPORT MAY CONTAIN FORWARD-LOOKING STATEMENTS WITHIN THE MEANING OF THE PRIVATE SECURITIES LITIGATION REFORM ACT OF 1995. FORWARD-LOOKING STATEMENTS INVOLVE INHERENT RISKS AND UNCERTAINTIES, AND WE MIGHT NOT BE ABLE TO ACHIEVE THE PREDICTIONS, FORECASTS, PROJECTIONS AND OTHER OUTCOMES WE MAY DESCRIBE OR IMPLY. A NUMBER OF IMPORTANT FACTORS COULD CAUSE RESULTS TO DIFFER MATERIALLY FROM THE PLANS, OBJECTIVES, EXPECTATIONS, ESTIMATES AND INTENTIONS WE EXPRESS IN THESE FORWARD-LOOKING STATEMENTS. WE DO NOT INTEND TO UPDATE THESE FORWARD-LOOKING STATEMENTS EXCEPT AS MAY BE REQUIRED BY APPLICABLE LAWS. NO PART OF THIS


What's been said:
Discussions found on the web: