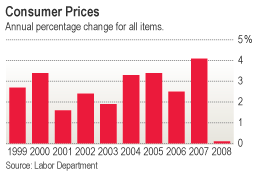
 There are several different ways to calculate annual consumer inflation.
The two most common ways BLS officials do this is to compare a) December to December, calendar year data; b) annual average CPI for 2008 versus average for 2007.
Most years, the variations between these approaches is quite minor. However, given the volatility we have seen in inflation data — most especially food, energy and commodity prices — this year, the two approaches produce very different results:
A mathematical oddity in Friday’s consumer price index means you can claim with some statistical backing that inflation last year was either 0.1% or 3.8%.
Measured on a December to December – or calendar year – basis, the consumer price index only grew 0.1% in 2008, according to Labor Department figures, the smallest gain in over 50 years and well below the 4.1% gain in 2007. But when the annual average of the CPI for all of 2008 is compared to the average for 2007, the increase was much higher, 3.8%. That was actually up from 2007’s rate. . . .
When it comes to assessing near-term trends, economists prefer calendar-year changes, which is why Wall Street research notes universally mentioned the 0.1% figure, and not the 3.8% one. The two series should even out over time, and in 2009 the calendar-year increase will probably be much higher than the average annual increase given the low base that the CPI index is starting at this year
Labor Department analysts noted the large differences were quite unusual: The two series usually line up exactly; when they don’t, the differences are only a few tenths of a percentage point.
>
Source:
Did Inflation Really Dry Up Last Year?
Brian Blackstone
Real Time Economics, January 16, 2009, 3:02 pm
http://blogs.wsj.com/economics/2009/01/16/did-inflation-really-dry-up-last-year/


What's been said:
Discussions found on the web: