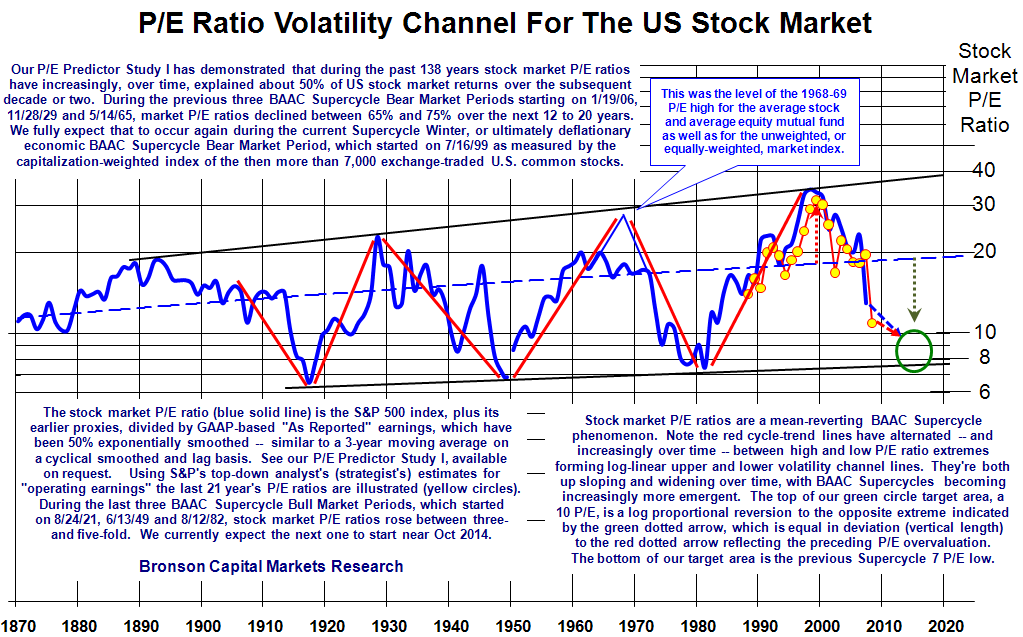
Here’s another brutal look at where P/E rations might end up going before this is all over, via Bob Bronson:
I am very skeptical of earnings forecasts, because they have been so terrible for most of my adult life. The conspiracy of optimists always seems to overestimate future earnings.
Trailing earnings are real data, not opinion of guesswork. They provide a factual basis for valuation, and not a wishful or theoretical version. Those who were claiming that there is no recession have now taken to saying we are at the worst levels of the recession. Often, we see forward earnings estimates at the heart of this faulty analysis.
Forward earnings guesswork are why the analyst community missed the credit crisis, why they could expected a 20% Q3, and 50% Q4 earnings rebound. Hence, the forward earnings consensus led to calls for 1350 and even 1550 on the S&P . . . Its now about half of that.
Rather than rely on Wall Street Analysts who are chock full of the conflicts, and seem structurally incapable of catching major economic turns, let’s revisit a long term look at P/E ratios, via historical cycles.
>
chart via Bob Bronson Capital Management
>
UPDATE February 16, 2009 11:58am
The key point of the chart is that earnings and P/Es are cyclical. Spare us the your slacker analysis, merely stating that “you can make any chart look however you want.” (At least this sarcasm is amusing).
Rather than merely dismiss this, I suggest you instead come up with something demonstrating stocks are cheap or even fairly priced. Or alternatively, due some work and prove the chart is wrong. But no more lazy junk science.
Ignore this chart if you want — but I think it suggest the market is still not “Very Cheap” based upon prior cycles.
>
Previously:
Bear Market Bottoms & P/E Ratios (January 15, 2009)
http://www.ritholtz.com/blog/2009/01/bear-market-bottoms-pe-ratios/


What's been said:
Discussions found on the web: