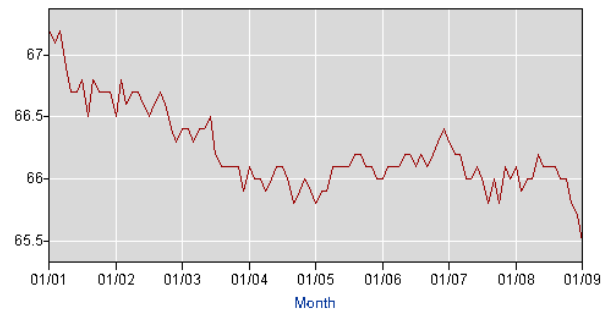
Since we are delving into the NFP report, let’s take an even closer look at something that is often ignored: Changes in the Labor Force and the Civilian Labor Force Participation Rate.
You may recall that we have frequently exhorted people to pay attention to NILF — those people Not in Labor Force.
Over the past few years, dishonest politicos failed to mention that Unemployment had gone down primarily due to people leaving the labor pool — not due to a surge of new job creation.
Let’s go to the Labor Force data. Between January 2008 and January 2009, we saw the following changes, as measured and defined by BLS:
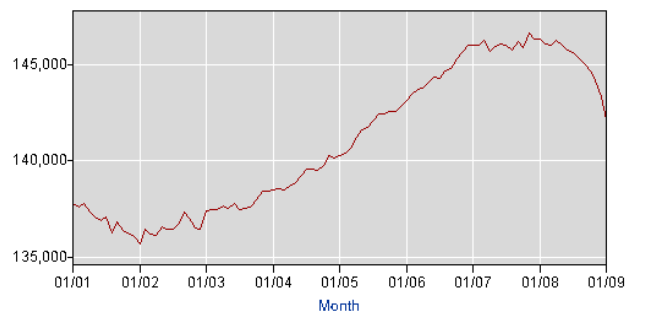
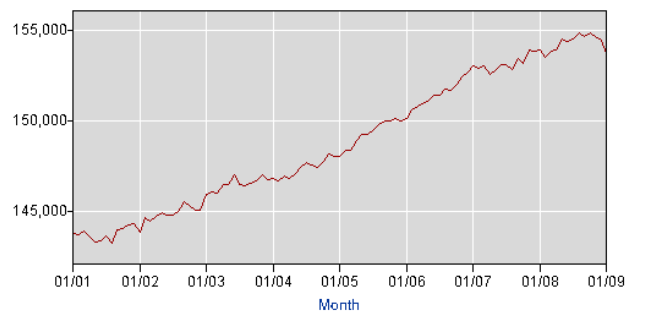
The Civilian labor force fell by just 108,000. Employment fell by over 4 million (4.149m), while Unemployment rose by nearly the same amount (4.040m). The number of people who dropped out of the labor pool rose by over 2 million (2,231m).
Labor Force Statistics from the Current Population Survey
Employment Level
Civilian Labor Force Level
Labor Force Participation Rate
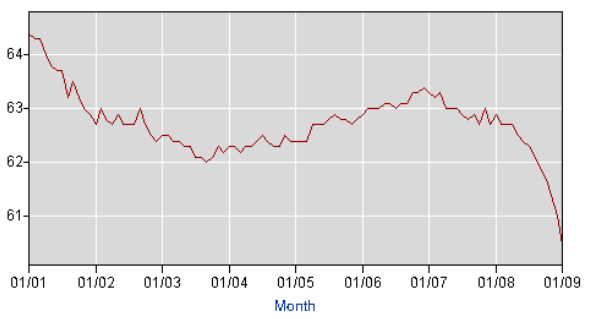
Employment-Population Ratio
All of these charts suggest that employment levels have been pretty meager for the past decade or so. These last two charts in particular tell the astute viewer that the Employment Situation started heading south back in January 2007.
>
Previously:
4.6% Unemployment is actually 5.5% (September 11th, 2007)
http://www.ritholtz.com/blog/2007/09/46-unemployment-is-actually-55/
Undercounting Under-Employment (November 6th, 2008)
http://www.ritholtz.com/blog/2008/11/undercounting-underemployed/
>
Sources:
THE EMPLOYMENT SITUATION: JANUARY 2009
BLS, Employment Situation Summary
http://www.bls.gov/news.release/empsit.toc.htm
Databases, Tables & Calculators by Subject
BLS
http://data.bls.gov/PDQ/servlet/SurveyOutputServlet
jan-09-bls-clfd (Excel)


What's been said:
Discussions found on the web: