Attention Gold Bugs: Warm up your credit cards!
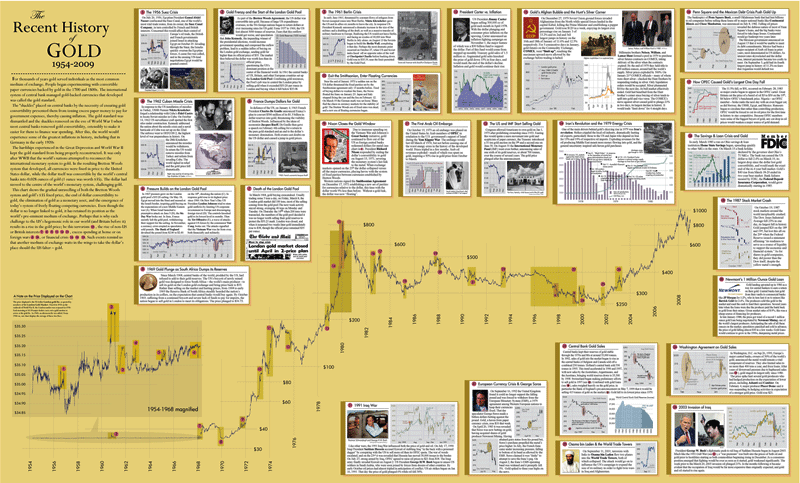
Back in 2007, we ran this terrific chart by JP Koning of the History of the Dow. JP is at it again, this time, devising this fascinating pictograph showing the Recent History of Gold.
JP adds:
“The Recent History of Gold Wall Chart contains the gold price from 1954-2009, as well as 26 crucial events that dramatically affected that price, including the Cuban Missile Crisis, the 1973 oil embargo, and the 2001 World Trade Tower bombing.
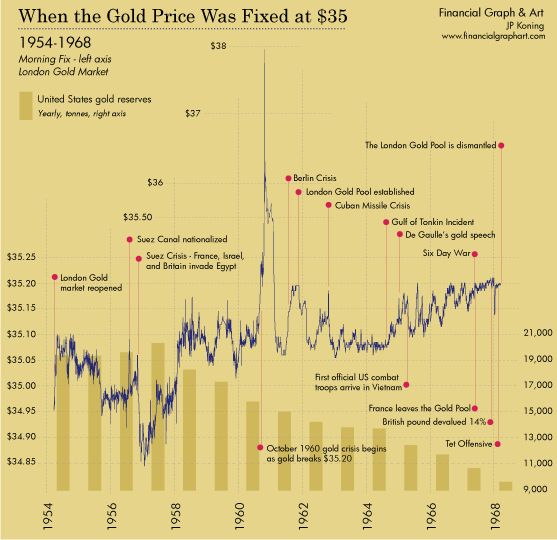
Also unique is our inclusion of prices from 1954-1968, when gold was fixed at $35. In actuality, the gold price fluctuated in a narrow band between $34.80 and $35.20, and was much influenced by world events. Our chart is one of the first to return to this lost data and analyse it.”
Educational and fascinating . . .


What's been said:
Discussions found on the web: